Chapter 16: Statistics and Data Plots 265
16STATS.DOC TI-89/TI-92 Plus: Statistics and Data Plots (English) Susan Gullord Revised: 02/23/01 1:12 PM Printed: 02/23/01 2:17 PM Page 265 of 22
Item Description
Freq
Type the column number that contains a “weight”
value for each data point. If you do not enter a
column number, all data points are assumed to
have the same weight (
1
).
Category
Type the column number that contains a category
value for each data point.
Include
Categories
If you specify a
Category
, you can use this to limit
the calculation to specified category values. For
example, if you specify {
1,4
}, the plot uses only
data points with a category value of
1
or
4
.
5. Press
¸
(after typing in an input box, press
¸
twice).
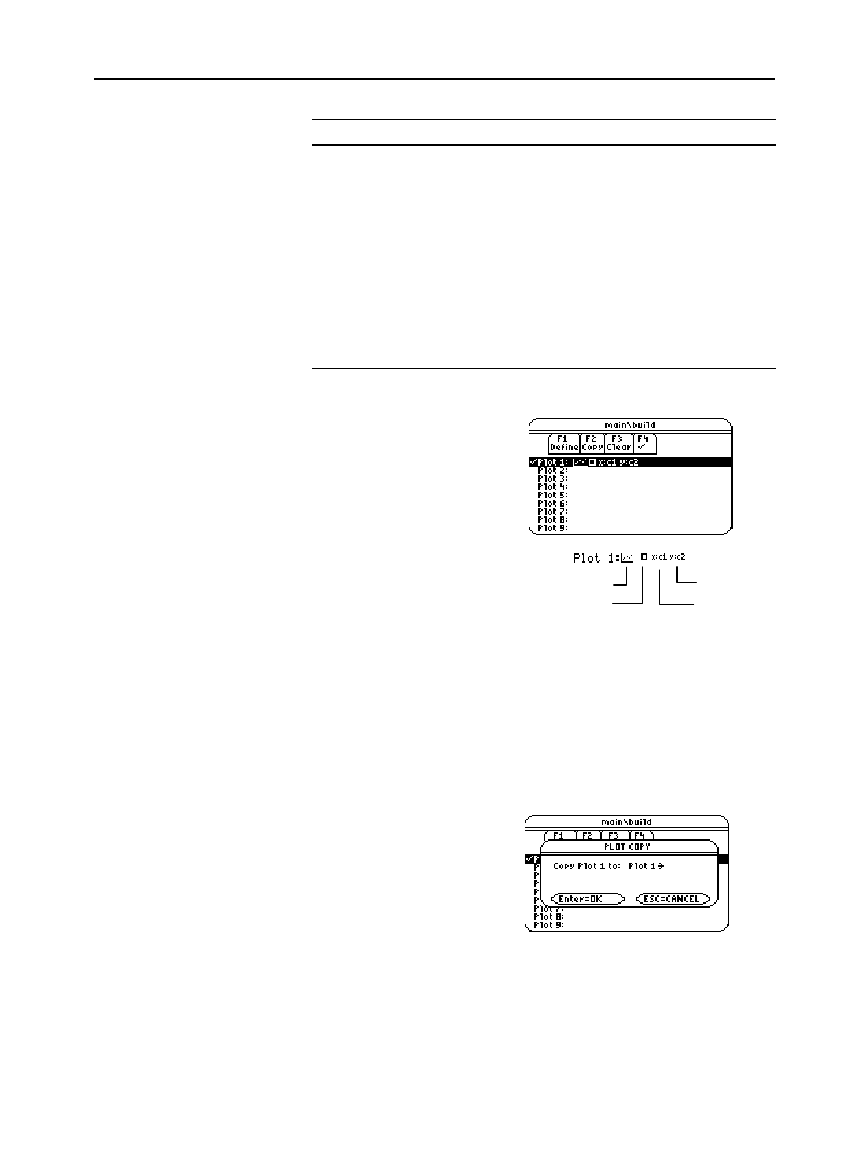
The
Plot Setup
screen is
redisplayed.
The plot you just
defined is automatically
selected for graphing.
Notice the shorthand
definition for the plot.
From
Plot Setup
, highlight the plot and press
†
to toggle it on or off.
If a stat plot is selected, it remains selected when you:
¦ Change the graph mode. (Stat plots are not graphed in 3D mode.)
¦
Execute a
Graph
command.
¦ Open a different variable in the Data/Matrix Editor.
From
Plot Setup
:
1. Highlight the plot and
press
„
.
2. Press
B
and select the
plot number that you
want to copy to.
3. Press
¸
.
From
Plot Setup
, highlight the plot and press
…
. To redefine an
existing plot, you do not necessarily need to clear it first; you can
make changes to the existing definition. To prevent a plot from
graphing, you can deselect it.
Note: For an example of
using Freq, Category, and
Include Categories, refer to
page 270.
Note: Any undefined data
points (shown as
undef
) are
ignored in a stat plot.
Selecting or
Deselecting a Plot
Copying a Plot
Definition
Note: If the original plot was
selected (
Ÿ
), the copy is
also selected.
Clearing a Plot
Definition
Plot Type = Scatter
x = c1
y = c2
Mark = Box


