


Chapter 11: Differential Equation Graphing 181
11DIFFEQ.DOC TI-89/TI-92 Plus: Differential Equation (English) Susan Gullord Revised: 02/23/01 11:04 AM Printed: 02/23/01 2:15 PM Page 181 of 26
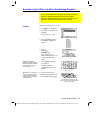
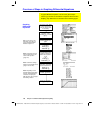
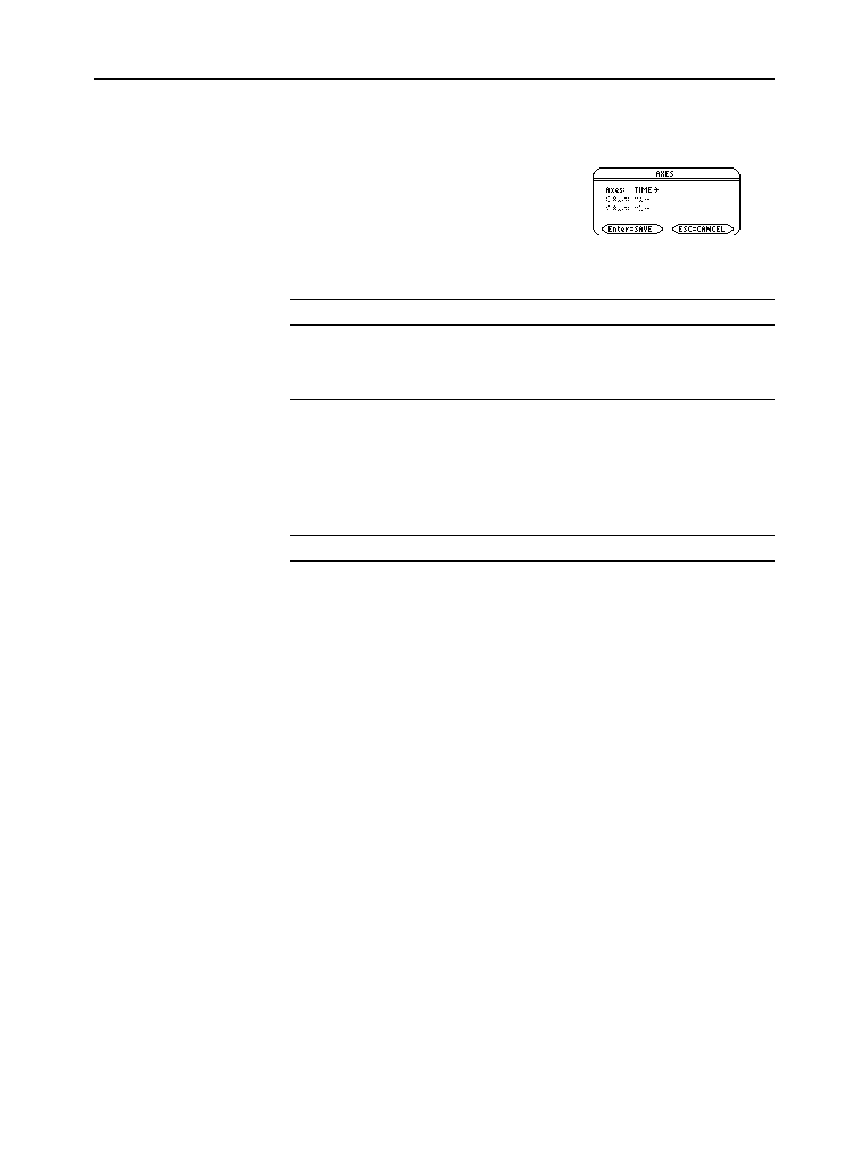
In the Y= Editor,
Axes
may or may not be available, depending on the
current graph format.
If it is available, you can select the
axes that are used to graph the
differential equations. For more
information, refer to page 190.
TI
-
89
:
2‰
TI
-
92 Plus:
‰
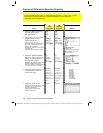
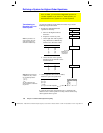
Axes Description
TIME
Plots
t
on the x axis and
y
(the solutions to the selected
differential equations) on the y axis.
CUSTOM
Lets you select the x and y axes.
Differential equation graphs use the following Window variables.
Depending on the
Solution Method
and
Fields
graph formats, not all of
these variables are listed in the Window Editor (
¥$
) at the
same time.
Variable Description
t0
Time at which the initial conditions entered in the
Y= Editor occur. You can set
t0
in the Window Editor
and Y= Editor. (If you set
t0
in the Y= Editor,
tplot
is set
to the same value automatically.)
tmax,
tstep
Used to determine the
t
values where the equations are
plotted:
y'(t0)
y'(t0+tstep)
y'(t0+2
ù
tstep)
... not to exceed ...
y'(tmax)
If
Fields = SLPFLD
,
tmax
is ignored. Equations are
plotted from
t0
to both edges of the screen in
tstep
increments.
tplot
First
t
value plotted. If this is not a
tstep
increment,
plotting begins at the next
tstep
increment. In some
situations, the first points evaluated and plotted
starting at
t0
may not be interesting visually. By setting
tplot
greater than
t0
, you can start the plot at the
interesting area, which speeds up the graphing time
and avoids unnecessary clutter on the Graph screen.
Setting Axes
Window Variables
Note: If
tmax
<
t0
,
tstep
mus
t
be negative.
Note: If
Fields=SLPFLD
,
tplot
is ignored and is
assumed to be the same
as
t0
.