


Chapter 13: Tables 221
13TABLES.DOC TI-89/TI-92 Plus: Tables (English) Susan Gullord Revised: 02/23/01 1:08 PM Printed: 02/23/01 2:16 PM Page 221 of 10
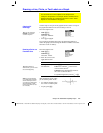
Chapter 13:
Tables
Preview of Tables................................................................................... 222
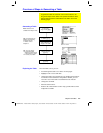
Overview of Steps in Generating a Table............................................ 223
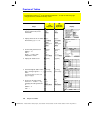
Setting Up the Table Parameters ......................................................... 224
Displaying an Automatic Table ............................................................ 226
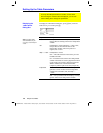
Building a Manual (Ask) Table............................................................. 229
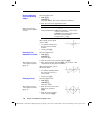
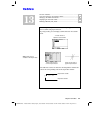
Previously, in Chapter 6: Basic Function Graphing, you learned
how to define and graph a function.
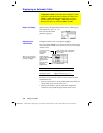
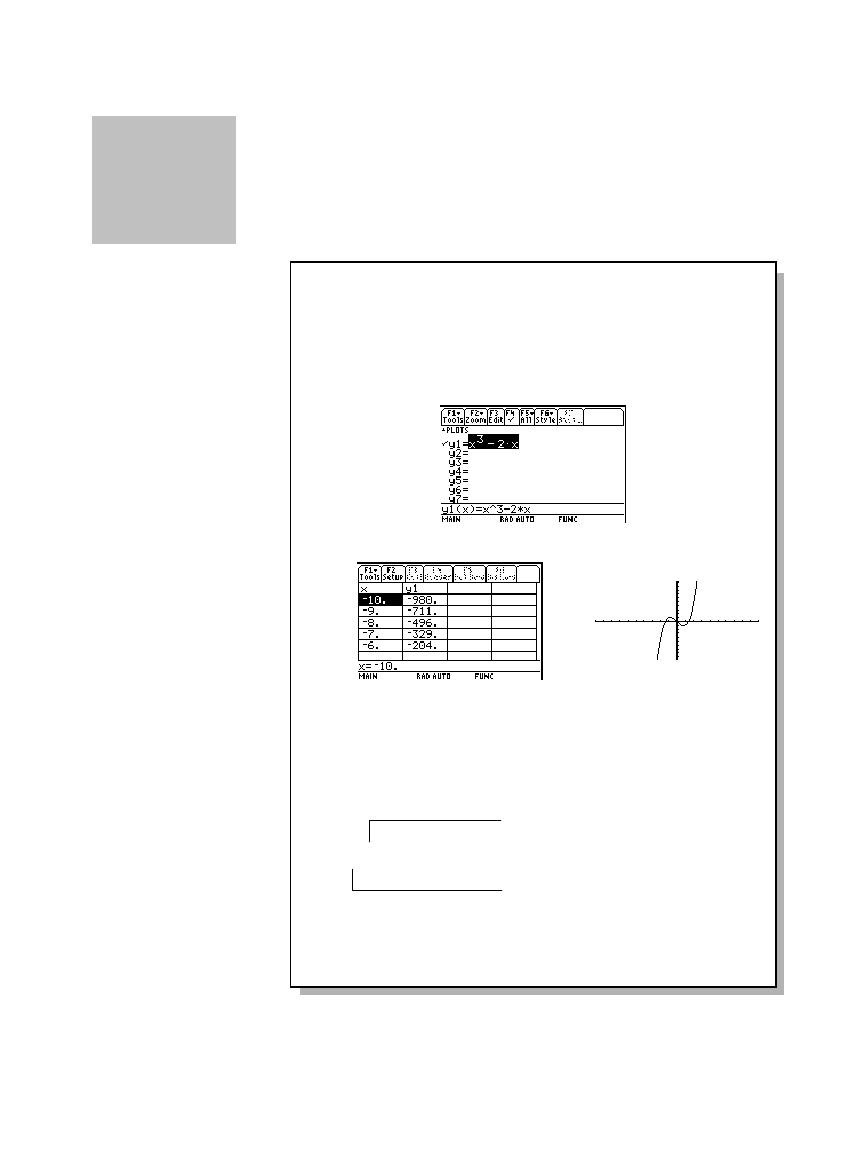
By using a table, you can display a defined function in a tabular
form.
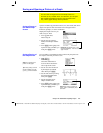
Y= Editor shows an
algebraic representation.
Table screen shows a
numeric representation.
Graph screen shows a
graphic representation.
The table lists a series of values for the independent variable and
shows the corresponding value of the dependent variable.
y(x) = x
3
ì
2x
13
Note: Tables are not
available in 3D Graph mode.
Independent variable
Dependent variable