


Chapter 13: Tables 223
13TABLES.DOC TI-89/TI-92 Plus: Tables (English) Susan Gullord Revised: 02/23/01 1:08 PM Printed: 02/23/01 2:16 PM Page 223 of 10
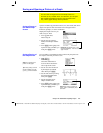
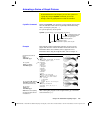
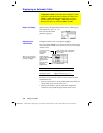
From the Table screen, you can:
¦ Scroll through the table to see values on other pages.
¦ Highlight a cell to see its full value.
¦ Change the table’s setup parameters. By changing the starting or
incremental value used for the independent variable, you can
zoom in or out on the table to see different levels of detail.
¦ Change the cell width.
¦ Edit selected functions.
¦ Build or edit a manual table to show only specified values of the
independent variable.
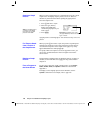
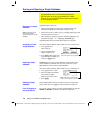
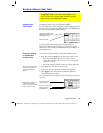
Overview of Steps in Generating a Table
To generate a table of values for one or more functions, use
the general steps shown below. For specific information about
setting table parameters and displaying the table, refer to the
following pages.
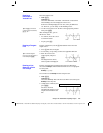
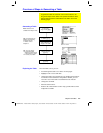
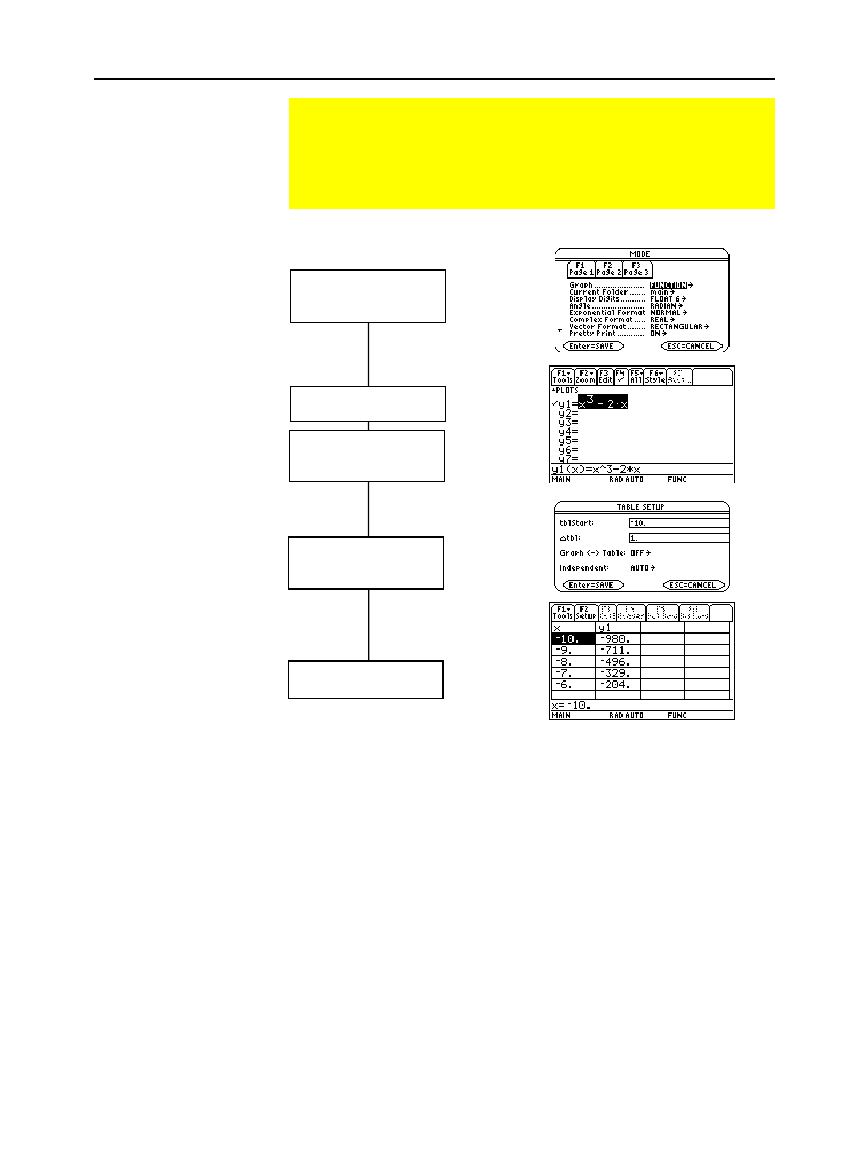
Generating a Table
Exploring the Table
Set Graph mode and,
if necessary,
Angle mode (3).
Define functions on
Y= Editor (¥ #).
Select (†) which
defined functions to
display in the table.
Set up the initial
table parameters
(¥ &).
Display the table
(¥ ').
Tip:
For information on
defining and selecting
functions with the
Y= Editor, refer to
Chapter 6.
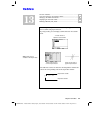
Note:
Tables are not
available in 3D Graph mode.
Tip:
You can specify:
•
An automatic table
−
Based on initial values.
−
That matches a graph.
•
A manual (ask) table.