156 Chapter 10: 3D Graphing
10_3D.DOC TI-89/TI-92 Plus: 3D Graphing (English) Susan Gullord Revised: 02/23/01 11:00 AM Printed: 02/23/01 4:22 PM Page 156 of 2210_3D.DOC TI-89/TI-92 Plus: 3D Graphing (English) Susan Gullord Revised: 02/23/01 11:00 AM Printed: 02/23/01 4:22 PM Page 156 of 22
From the Graph screen, you can:
¦ Trace the equation.
¦ Use the
„
Zoom
toolbar menu to zoom in or out on a portion of
the graph. Some of the menu items are dimmed because they are
not available for 3D graphs.
¦ Use the
‡
Math
toolbar menu to evaluate the equation at a
specified point. Only
1:Value
is available for 3D graphs.
Overview of Steps in Graphing 3D Equations
To graph 3D equations, use the same general steps used for
y(x) functions as described in Chapter 6: Basic Function
Graphing. Any differences that apply to 3D equations are
described on the following pages.
Graphing 3D
Equations
Exploring the Graph
Tip: You can also evaluate
z(x,y) while tracing. Type
the x value and press
¸
; then type the y value
and press
¸
.
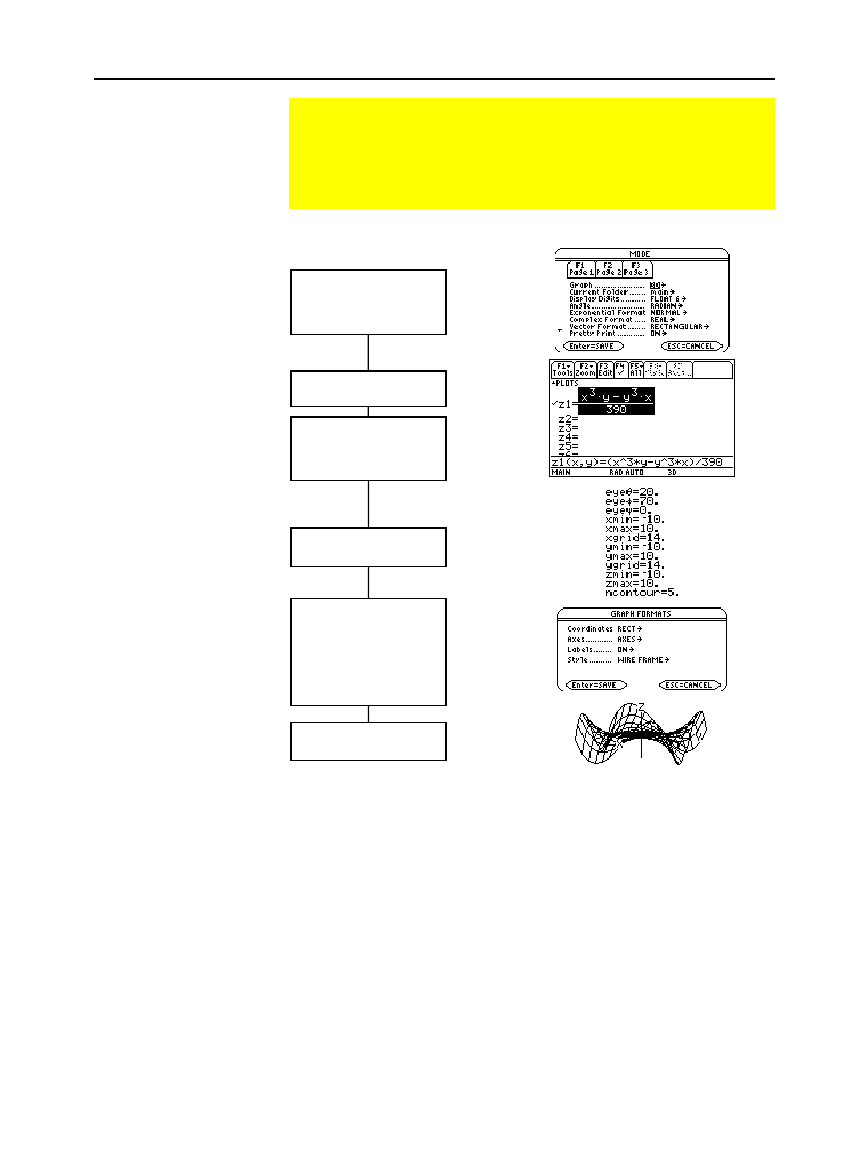
Set Graph mode (
3
)
to 3D.
Also set Angle mode,
if necessary.
Define 3D equations on
Y= Editor (
¥
#
).
Select (
†
) which
equation to graph. You
can select only one 3D
equation.
Define the viewing cube
(
¥
$
).
Change the graph
format, if necessary.
ƒ
9
— or —
TI
-
89:
¥
Í
TI-92 Plus:
¥
F
Graph the selected
equation (
¥
%
).
Tip:
To help you see the
orientation of 3D graphs,
turn on Axes and Labels.
Note:
Before displaying the
graph, the screen shows
the “percent evaluated.”
Tip:
To turn off any stat
data plots (Chapter 16),
press
‡
5
or use
†
to
deselect them.
Note:
For 3D graphs, the
viewing window is called
the viewing cube.
„
Zoom
also changes the viewing
cube.


