Chapter 12: Additional Graphing Topics 203
12ADDLGR.DOC TI-89/TI-92 Plus: Additional Graphing Tools (English) Susan Gullord Revised: 02/23/01 1:03 PM Printed: 02/23/01 2:15 PM Page 203 of 20
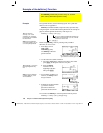
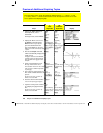
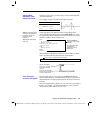
1. Display the graph. (This example shows
y1(x)=5
ù
cos(x)
.)
2. Display the coordinates or math results you want to collect.
3. Save the information to the Home screen or the
sysData
variable.
TI
-
89:
¥
·
(Home screen) or
¥
b
(sysData
variable)
TI
-
92 Plus:
¥
H
(Home screen) or ¥
D (sysData
variable)
4. Repeat the process as necessary.
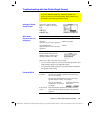
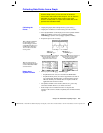
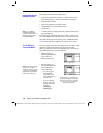
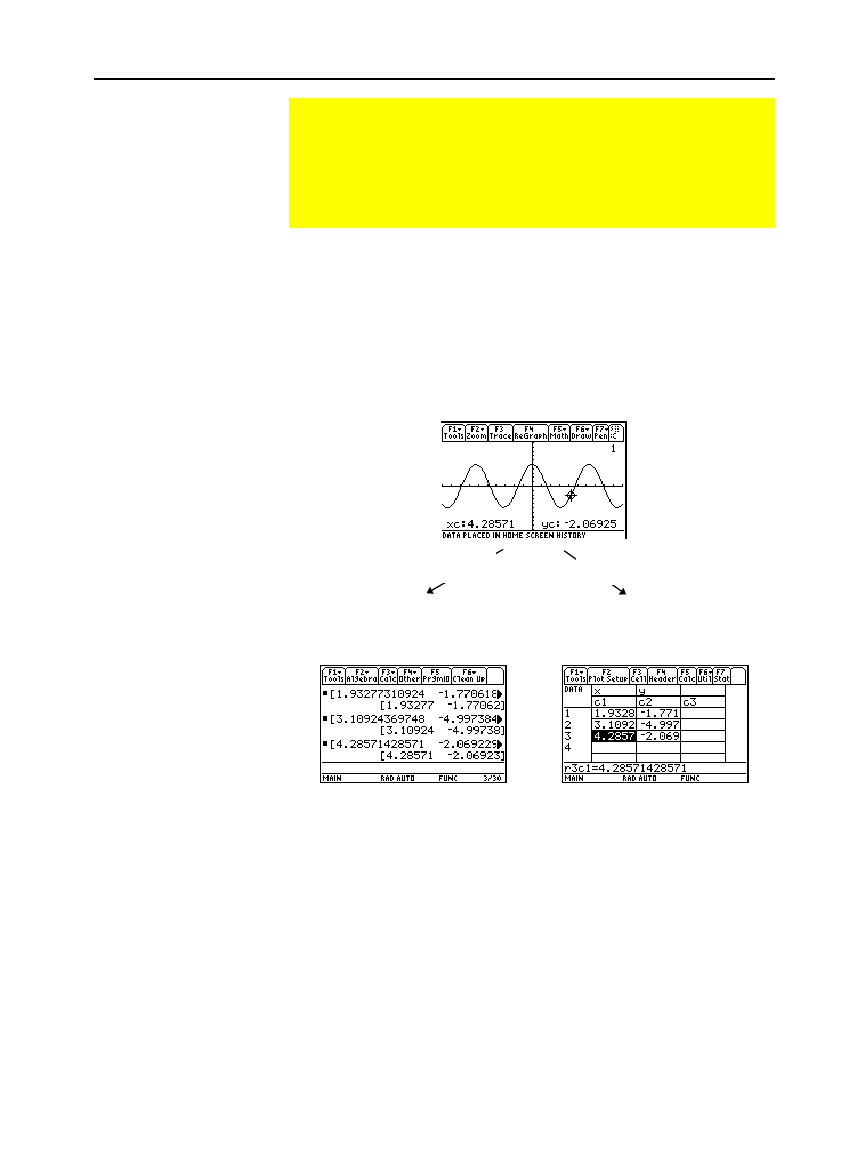
Displayed coordinates are added to
the Home screen’s history area
(but not the entry line) as a
single-row matrix or vector.
Displayed coordinates are stored in a
data variable named sysData,
which you can open in the
Data/Matrix Editor.
¦ When you press:
TI
-
89:
¥
b
TI
-
92 Plus:
¥
D
− If
sysData
does not exist, it is created in the
MAIN
folder.
− If
sysData
already exists, new data is appended to the end of
any existing data. Existing titles or column headers (for the
affected columns) are cleared; titles are replaced with the
applicable titles for the new data.
¦ The
sysData
variable can be cleared, deleted, etc., just as any
other data variable. However, it cannot be locked.
¦ If the Graph screen contains a function or stat plot that
references the current contents of
sysData
, this command will not
operate.
Collecting Data Points from a Graph
From the Graph screen, you can store sets of coordinate
values and/or math results for later analysis. You can store the
information as a single-row matrix (vector) on the Home
screen or as data points in a system data variable that can be
opened in the Data/Matrix Editor.
Collecting the
Points
Tip: To display coordinates
or math results, trace a
function with
…
or perform
an
‡
Math
operation (such
as Minimum or Maximum).
You can also use the free-
moving cursor.
Tip: Use a split screen to
show a graph and the Home
screen or Data/Matrix Editor
at the same time.
Notes about
SysData Variable
TI-89:
¥
·
TI-92 Plus:
¥
H
TI-89:
¥
b
TI-92 Plus:
¥
D


