


132 Chapter 7: Parametric Graphing
07PARAM.DOC TI-89/TI-92 Plus: Parametric Graphing (English) Susan Gullord Revised: 02/23/01 10:56 AM Printed: 02/23/01 2:13 PM Page 132 of 6
As in function graphing, you can explore a graph by using the
following tools.
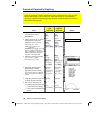
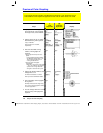
Tool For Parametric Graphs:
Free-Moving
Cursor
Works just as it does for function graphs.
„
Zoom
Works just as it does for function graphs, with the
following exceptions:
¦ Only
x
(
xmin
,
xmax
,
xscl
) and
y
(
ymin
,
ymax
,
yscl
)
Window variables are affected.
¦ The
t
Window variables (
tmin
,
tmax
,
tstep
) are not
affected unless you select
6:ZoomStd
(which sets
tmin = 0
,
tmax = 2
p
, and
tstep =
p
/24
).
…
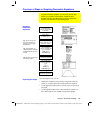
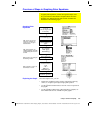
Trace
Lets you move the cursor along a graph one
tstep
at a
time.
¦ When you begin a trace, the cursor is on the first
selected parametric equation at
tmin
.
¦
QuickCenter
applies to all directions. If you move
the cursor off the screen (top or bottom, left or
right), press
¸
to center the viewing window
on the cursor location.
¦ Automatic panning is not available. If you move the
cursor off the left or right side of the screen, the
TI
-
89 / TI
-
92 Plus
will not automatically pan the
viewing window. However, you can use
QuickCenter
.
‡
Math
Only
1:Value
,
6:Derivatives
,
9:Distance
,
A:Tangent
, and
B:Arc
are available for parametric graphs. These tools
are based on
t
values. For example:
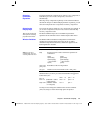
¦
1:Value
displays
x
and
y
values for a specified
t
value.
¦
6:Derivatives
finds
dy/dx
,
dy/dt
, or
dx/dt
at a point
defined for a specified
t
value.
Exploring a Graph
Tip: During a trace, you can
also evaluate x(t) and y(t) b
y
typing the t value and
pressing
¸
.
Tip: You can use
QuickCenter at any time
during a trace, even if the
cursor is still on the screen.