


340 Chapter 19: Numeric Solver
19SOLVER.DOC TI-89/TI-92 Plus: Numeric Solver (English) Susan Gullord Revised: 02/23/01 1:16 PM Printed: 02/23/01 2:19 PM Page 340 of 10
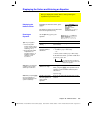
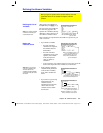
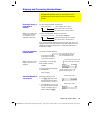
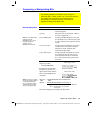
In the Numeric Solver, leave the
cursor on the unknown variable.
Press
…
and select:
1:Graph View
– or –
3:ZoomStd
– or –
4:ZoomFit
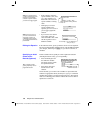
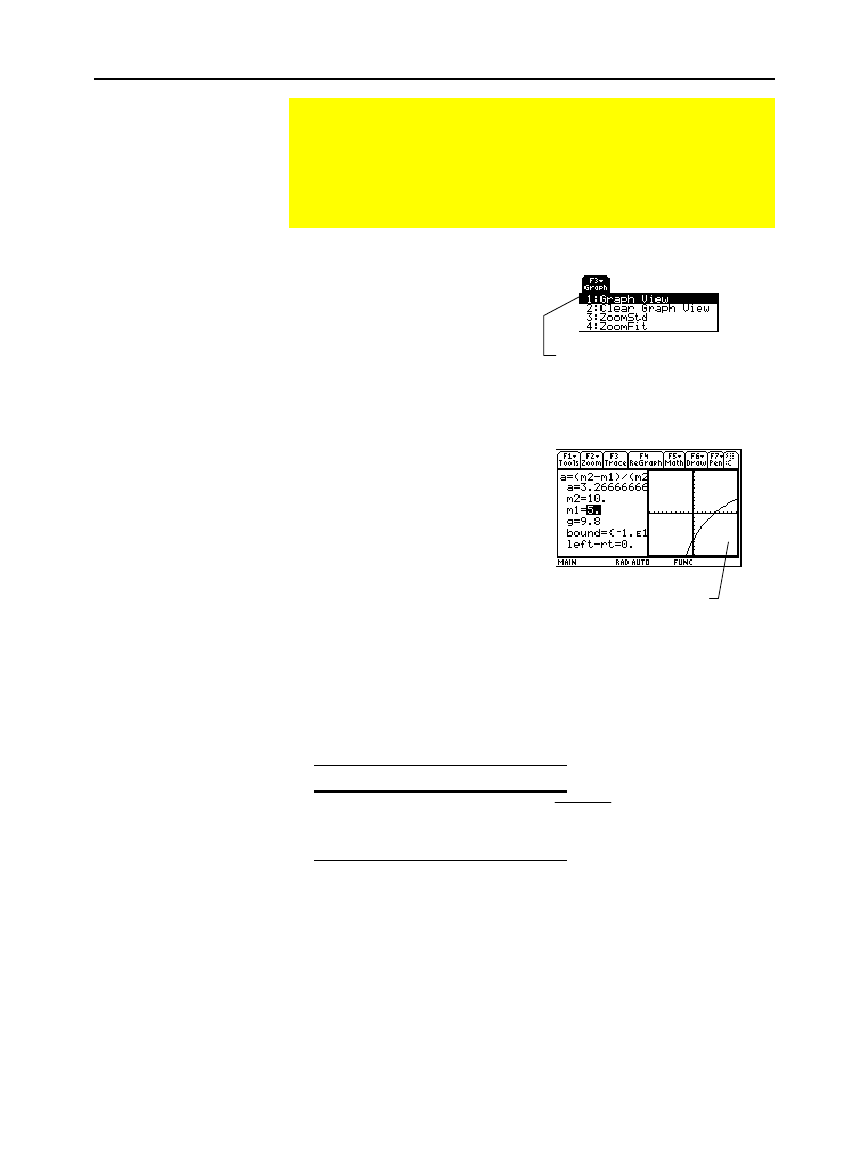
The graph is shown in a split
screen, where:
¦ The unknown variable is
plotted on the x axis.
¦
left
ì
rt
is plotted on the y axis.
Solutions for the equation exist
at
left
N
rt=0
, where the graph
crosses the x axis.
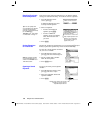
You can explore the graph by using the free-moving cursor, tracing,
zooming, etc., as described in Chapter 6.
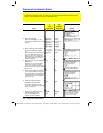
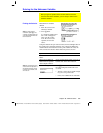
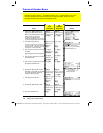
When you use the Numeric Solver to display a graph:
¦ The following modes are changed automatically to these settings:
Mode Setting
Graph FUNCTION
Split Screen LEFT-RIGHT
Number of Graphs 1
¦ All stat plots are deselected.
¦ After you leave the Numeric Solver, the Graph screen may
continue to display the equation’s solution, ignoring any selected
Y= functions. If so, display the Y= Editor and then return to the
Graph screen. Also, the graph is reset when you change the
Graph
mode or use
ClrGraph
from the Home screen (
†
5
) or a program.
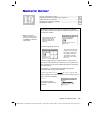
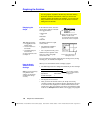
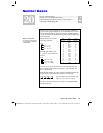
Graphing the Solution
You can graph an equation’s solutions any time after defining
the known variables, either before or after you solve for the
unknown variable. By graphing the solutions, you can see how
many solutions exist and use the cursor to select an accurate
initial guess and bounds.
Displaying the
Graph
Tips: With split screens:
• Use
2a
to switch
between sides.
• The active side has a
thick border.
• The toolbar belongs to
the active side.
For more information, refer
to Chapter 14.
How the Graph
Affects Various
Settings
Note: If you were previously
using different mode
settings, you will need to
reselect those settings
manually.
Graph View uses the current
Window variable values.
For information about ZoomStd
and ZoomFit, refer to Chapter 6.
Any functions selected
in the Y= Editor will not
be graphed.
The current graph format
settings are used.