


Chapter 10: 3D Graphing 169
10_3D.DOC TI-89/TI-92 Plus: 3D Graphing (English) Susan Gullord Revised: 02/23/01 11:00 AM Printed: 02/23/01 4:22 PM Page 169 of 22
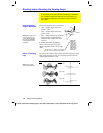
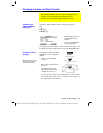
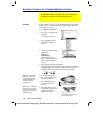
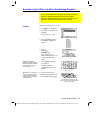
From the Graph screen, display the Draw menu and then select
8:DrwCtour
. The Home screen is displayed automatically with
DrwCtour
in the entry line. You can then specify one or more z values
individually or generate a sequence of z values.
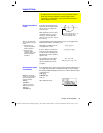
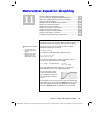
Some examples are:
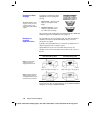
DrwCtour 5
DrwCtour {1,2,3}
DrwCtour seq(n,n,
ë
10,10,2)
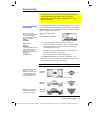
The specified contours are drawn on the current 3D graph.
(A contour is not drawn if the specified z value is outside the viewing
cube or if the 3D graph is not defined at that z value.)
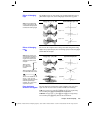
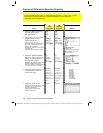
For a contour plot:
¦ You can use the cursor keys (page 164) to animate the contour
plot.
¦ You cannot trace (
…
) the contours themselves. However, you
can trace the wire frame as seen when
Style=WIRE AND
CONTOUR
.
¦ It may take awhile to evaluate the equation initially.
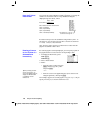
¦ Because of possible long evaluation times, you first may want to
experiment with your 3D equation by using
Style=WIRE FRAME
.
The evaluation time is much shorter. Then, after you’re sure you
have the correct Window variable values, display the Graph
Formats dialog box and set
Style=CONTOUR LEVELS
or
WIRE
AND CONTOUR
.
TI
-
89:
¥Í
TI
-
92 Plus
:
¥
F
Drawing Contours
for Specified Z
Values
Tip: To remove the default
contours, use
¥$
and set
ncontour=0
.
Notes about
Contour Plots
Draws a contour for z=5.
Draws contours for z=1, 2, and 3.
Draws contours for a sequence of z
values from
ë
10 through 10 in
steps of 2 (
ë
10,
ë
8,
ë
6, etc.).