


182 Chapter 11: Differential Equation Graphing
11DIFFEQ.DOC TI-89/TI-92 Plus: Differential Equation (English) Susan Gullord Revised: 02/23/01 11:04 AM Printed: 02/23/01 2:15 PM Page 182 of 26
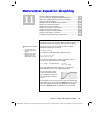
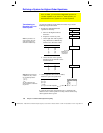
xmin
,
xmax
,
ymin
,
ymax
Boundaries of the viewing window.
xscl
,
yscl
Distance between tick marks on the x and y axes.
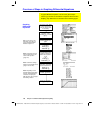
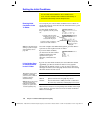
ncurves
Number of solution curves (0 through 10) that will be
drawn automatically if you do not specify an initial
condition. By default,
ncurves = 0
.
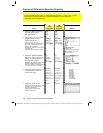
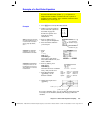
When
ncurves
is used,
t0
is set temporarily at the middle
of the screen and initial conditions are distributed
evenly along the y axis, where:
increment =
ymax
ì
ymin
ncurves + 1
The
y
values for the initial conditions are:
ymin + increment
ymin + 2
ù
(increment)
©
ymin + ncurves
ù
(increment)
diftol
(
Solution Method = RK
only) Tolerance used by the
RK
method to help select a step size for solving the
equation; must be
‚
1
E
ë
14.
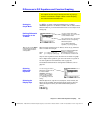
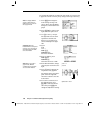
fldres
(
Fields = SLPFLD
or
DIRFLD
only) Number of columns
(1 through 80) used to draw a slope or direction field
across the full width of the screen.
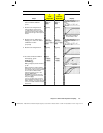
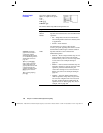
Estep
(
Solution Method = EULER
only) Euler iterations
between
tstep
values; must be an integer >0. For more
accuracy, you can increase
Estep
without plotting
additional points.
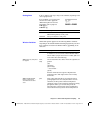
dtime
(
Fields = DIRFLD
only) Point in time at which a
direction field is drawn.
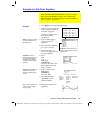
Standard values (set when you select
6:ZoomStd
from the
„
Zoom
toolbar menu) are:
t0 = 0.
xmin =
ë
1. ymin =
ë
10. ncurves = 0.
tmax = 10. xmax = 10. ymax = 10. diftol = .001
tstep = .1 xscl = 1. yscl = 1. Estep = 1.
tplot = 0. fldres = 14.
dtime = 0.
You may need to change the standard values for the
t
variables to
ensure that sufficient points are plotted.
Window Variables
(Continued)
Note: For information about
how the Fields graph format
affects whether ncurves is
used, refer to page 184.