


232 Chapter 14: Split Screens
14SPLIT.DOC TI-89/TI-92 Plus:Split Screens (English) Susan Gullord Revised: 02/23/01 1:09 PM Printed: 02/23/01 2:16 PM Page 232 of 6
Steps
³
TI-89
Keystrokes
›
TI-92 Plus
Keystrokes Display
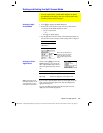
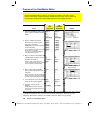
1. Display the
MODE
dialog box.
For
Graph
, select
FUNCTION
.
For
Split Screen
, select
LEFT-RIGHT
.
For
Split 1 App
, select
Y= Editor
.
For
Split 2 App
, select
Graph
.
3
B
1
„B
3
DB
2
DB
4
¸
3
B
1
„B
3
DB
2
DB
4
¸
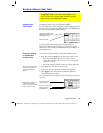
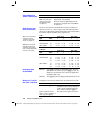
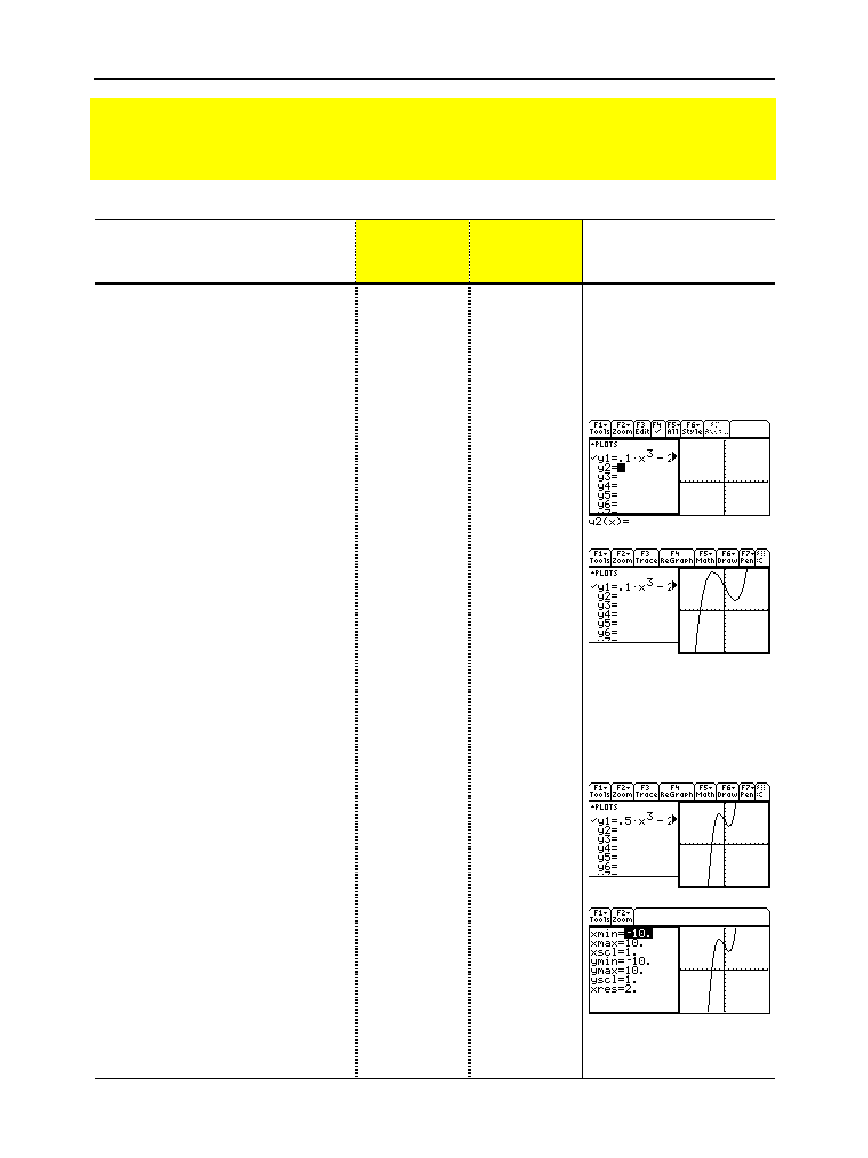
2. Clear the Y= Editor and turn off
any stat data plots. Then define
y1(x) = .1x
3
–2x+6
.
A thick border around the Y= Editor
indicates it is active. When active, its
entry line goes all the way across the
display.
ƒ
8
¸
‡
5
¸
.1X
Z
3
|
2X
«
6
¸
ƒ
8
¸
‡
5
¸
.1X
Z
3
|
2X
«
6
¸
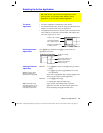
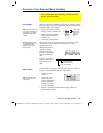
3. Select the
ZoomStd
viewing
window, which switches to the
Graph screen and graphs the
function.
The thick border is now around the
Graph screen.
„
6
„
6
4. Switch to the Y= Editor. Then
edit
y1(x)
to change
.1x
3
to
.5x
3
.
2a
is the second function of
O
.
The thick border is around the
Y= Editor.
2a
C¸
ABB0
5
¸
2a
C¸
ABB0
5
¸
5. Switch to the Graph screen,
which regraphs the edited
function.
The thick border is around the Graph
screen.
2a
2a
6. Switch to the Y= Editor. Then
open the Window Editor in its
place.
2a
¥$
2a
¥$
7. Open the Home screen. Then
exit to a full-sized Home screen.
2K
2K
2K
2K
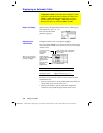
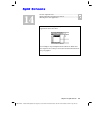
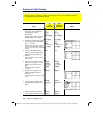
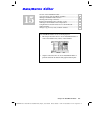
Preview of Split Screens
Split the screen to show the Y= Editor and the Graph screen. Then explore the behavior
of a polynomial as its coefficients change.