


170 Chapter 10: 3D Graphing
10_3D.DOC TI-89/TI-92 Plus: 3D Graphing (English) Susan Gullord Revised: 02/23/01 11:00 AM Printed: 02/23/01 4:22 PM Page 170 of 2210_3D.DOC TI-89/TI-92 Plus: 3D Graphing (English) Susan Gullord Revised: 02/23/01 11:00 AM Printed: 02/23/01 4:22 PM Page 170 of 22
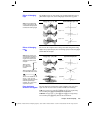
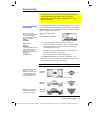
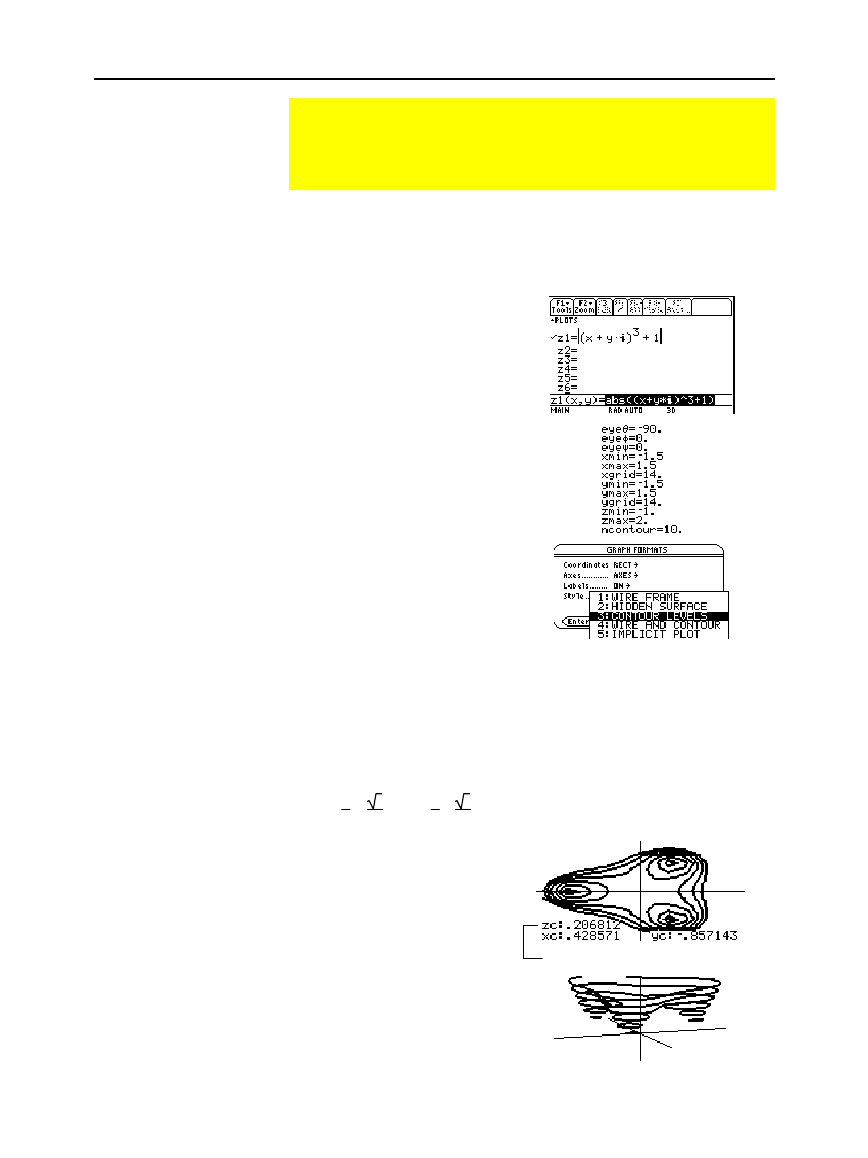
In this example, let f(x)=x
3
+1. By substituting the general complex
form x+y
i for x, you can express the complex surface equation as
z(x,y)=abs((x+y
ù
i)
3
+1).
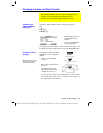
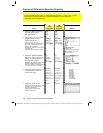
1. Use
3
to set
Graph
=
3D
.
2. Press
¥#
, and define the
equation:
z1(x,y)=abs((x+y
ù
i)^3+1)
3. Press
¥$
, and set
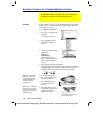
the Window variables as
shown.
4. Display the Graph Formats
dialog box:
TI
-
89:
¥Í
TI
-
92 Plus
:
¥
F
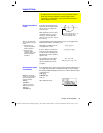
Turn on the axes, set
Style = CONTOUR LEVELS
,
and return to the Window
editor.
5. Press
¥%
to graph the equation.
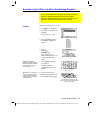
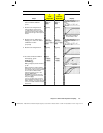
It will take awhile to evaluate the graph; so be patient. When the
graph is displayed, the complex modulus surface touches the
xy plane at exactly the complex zeros of the polynomial:
ë
1,
1
2
+
3
2
i
, and
1
2
ì
3
2
i
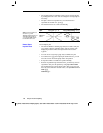
6. Press
…
, and move the
trace cursor to the zero in
the fourth quadrant.
The coordinates let you
estimate .428
ì
.857
i as
the zero.
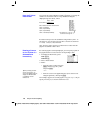
7. Press
N
. Then use the
cursor keys to animate the
graph and view it from
different
eye
angles.
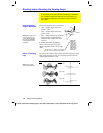
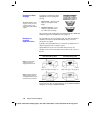
Example: Contours of a Complex Modulus Surface
The complex modulus surface given by z(a,b) = abs(f(a+b
i
))
shows all the complex zeros of any polynomial y=f(x).
Example
Note: For more accurate
estimates, increase the
xgrid
and
ygrid
Window
variables. However, this
increases the graph
evaluation time.
Tip: When you animate the
graph, the screen changes
to normal view. Use
p
to
toggle between normal and
expanded views.
The zero is precise when z=0.
This example shows eye
q
=70,
eye
f
=70, and eye
ψ
=0.