


Appendix A: Functions and Instructions 465
8992APPA.DOC TI-89 / TI-92 Plus: Appendix A (US English) Susan Gullord Revised: 02/23/01 1:48 PM Printed: 02/23/01 2:21 PM Page 465 of 132
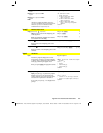
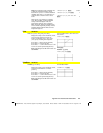
log()
CATALOG
log(
expression1
)
⇒
expression
log(
list1
)
⇒
list
Returns the base-10 logarithm of the
argument.
For a list, returns the base-10 logs of the
elements.
log(2.0)
¸
.301
...
If complex format mode is
REAL
:
log({
ë
3,1.2,5})
¸
Error: Non-rea
l
resu
l
t
If complex format mode is
RECTANGULAR
:
log({
ë
3,1.2,5})
¸
{
ln(3)
ln(10)
+
p
ln(10)
ø
i
.079
...
ln(5)
ln(10)
}
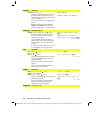
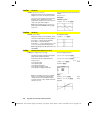
log(
squareMatrix1
)
⇒
squareMatrix
Returns the matrix base-10 logarithm of
squareMatrix1
. This is
not
the same as
calculating the base-10 logarithm of each
element. For information about the
calculation method, refer to
cos()
.
squareMatrix1
must be diagonalizable. The
result always contains floating-point
numbers.
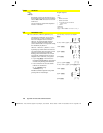
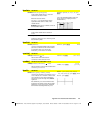
In Radian angle mode and Rectangular
complex format mode:
log([1,5,3;4,2,1;6,
ë
2,1])
¸
.795…+.753…
ø
i
.003…
ì
.647…
ø
i
…
.194…
ì
.315…
ø
i
.462…+.270
ø
i
…
ë
.115…
ì
.904…
ø
i
.488…+.777…
ø
i
…
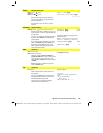
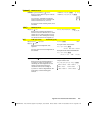
Logistic
MATH/Statistics/Regressions menu
Logistic
list1
,
list2
[
,
[
iterations
]
,
[
list3
] [
,
list4
,
list5
]
]
Calculates the logistic regression and updates
all the system statistics variables.
All the lists must have equal dimensions
except for
list5
.
list1
represents xlist.
list2
represents ylist.
list3
represents frequency.
list4
represents category codes.
list5
represents category include list.
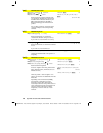
iterations
specifies the maximum number of
times a solution will be attempted. If omitted,
64 is used. Typically, larger values result in
better accuracy but longer execution times,
and vice versa.
Note:
list1
through
list4
must be a variable
name or c1–c99 (columns in the last data
variable shown in the Data/Matrix Editor).
list5
does not have to be a variable name and
cannot be c1–c99.
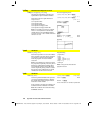
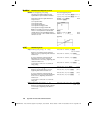
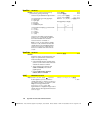
In function graphing mode:
{1,2,3,4,5,6}
!
L1
¸
{1 2 3 …}
{1,1.3,2.5,3.5,4.5,4.8}
!
L2
¸
{1 1.3 2.5 …}
Logistic L1,L2
¸
Done
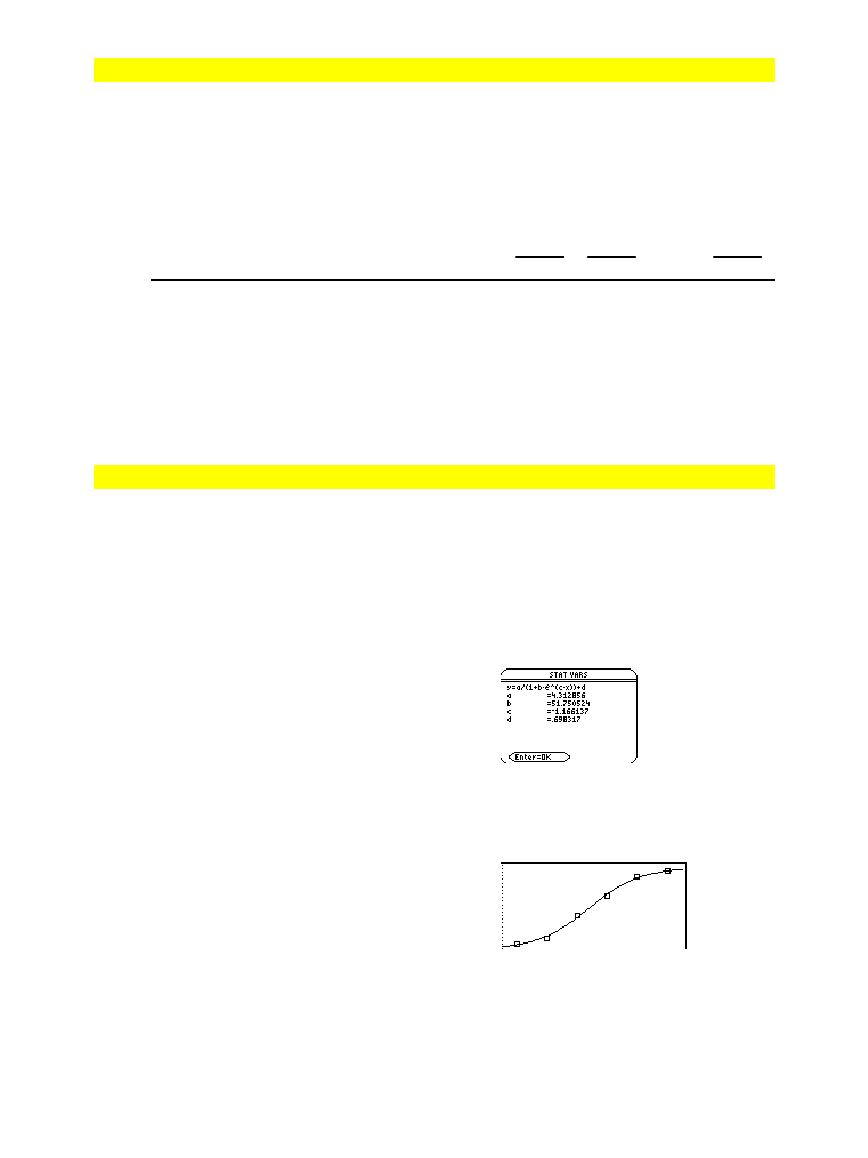
ShowStat
¸
¸
regeq(x)
!
y1(x)
¸
Done
NewPlot 1,1,L1,L2
¸
Done
¥%
„
9