


Chapter 16: Statistics and Data Plots 255
16STATS.DOC TI-89/TI-92 Plus: Statistics and Data Plots (English) Susan Gullord Revised: 02/23/01 1:12 PM Printed: 02/23/01 2:17 PM Page 255 of 22
Steps
³
TI
-
89
Keystrokes
›
TI
-
92 Plus
Keystrokes Display
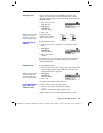
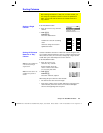
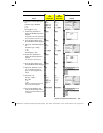
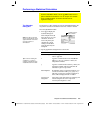
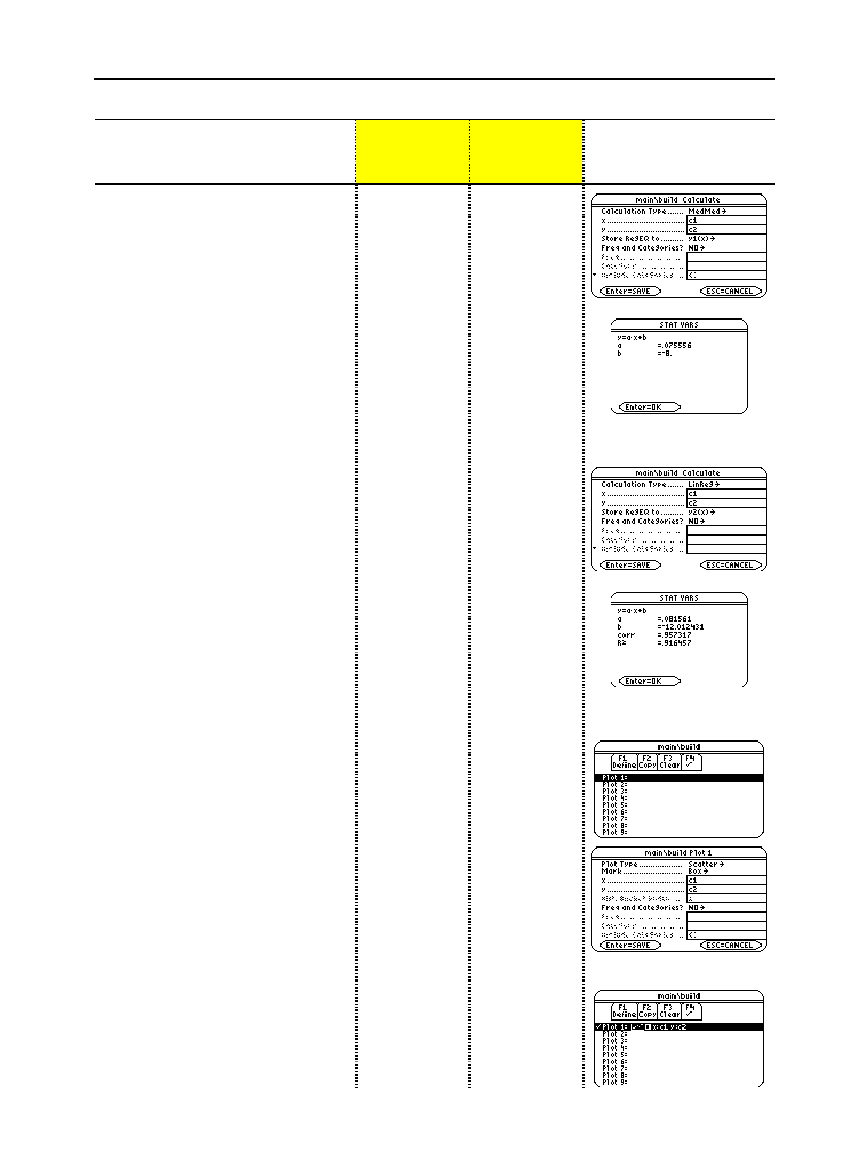
6. Display the
Calculate
dialog box.
Set:
Calculation Type = MedMed
x = C1
y = C2
Store RegEQ to = y1(x)
‡
B
7
D
C
j
1
D
j
C2
D
BD¸
‡
B
7
D
C1
D
C2
D
BD¸
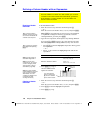
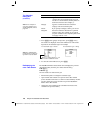
7. Perform the calculation to
display the MedMed regression
equation.
As specified on the
Calculate
dialog
box, this equation is stored in y1(x).
¸
¸
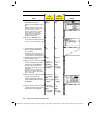
8. Close the
STAT VARS
screen.
The Data/Matrix Editor displays.
¸
¸
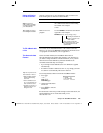
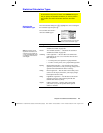
9. Display the
Calculate
dialog box.
Set:
Calculation Type = LinReg
x = C1
y = C2
Store RegEQ to = y2(x)
‡
B
5
D
D
D
BD¸
‡
B
5
D
D
D
BD¸
10. Perform the calculation to
display the LinReg regression
equation.
This equation is stored in y2(x).
¸
¸
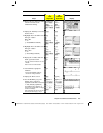
11. Close the
STAT VARS
screen.
The Data/Matrix Editor displays.
¸
¸
12. Display the
Plot Setup
screen.
Plot 1 is highlighted by default.
…
lets you clear highlighted Plot
settings.
„
„
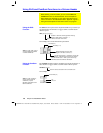
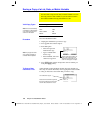
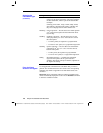
13. Define Plot 1 as:
Plot Type = Scatter
Mark = Box
x = C1
y = C2
Notice the similarities between this
and the
Calculate
dialog box.
ƒ
B
1
D
B
1
D
C
j
1
D
j
C2
ƒ
B
1
D
B
1
D
C1
D
C2
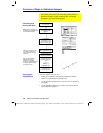
14. Save the plot definition and
return to the
Plot Setup
screen.
Notice the shorthand notation for Plot
1’s definition.
¸¸
¸¸