


Chapter 17: Programming 305
17PROGRM.DOC TI-89/TI-92 Plus: Programming (English) Susan Gullord Revised: 02/23/01 1:14 PM Printed: 02/23/01 2:18 PM Page 305 of 40
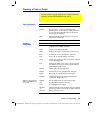
Command Description
DispTbl
Displays the current contents of the Table screen.
setTable
Sets the
Graph <–> Table
or
Independent
table
parameters. (To set the other two table parameters,
you can store the applicable values to the
tblStart
and
@
tbl
system variables.)
Table
Builds and displays a table based on one or more
expressions or functions.
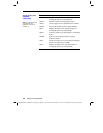
Command Description
ClrGraph
Erases any functions or expressions that were
graphed with the
Graph
command.
Define
Creates a user-defined function.
DispG
Displays the current contents of the Graph screen.
FnOff
Deselects all (or only specified) Y= functions.
FnOn
Selects all (or only specified) Y= functions.
Graph
Graphs one or more specified expressions, using the
current graphing mode.
Input
Displays the Graph screen and lets the user update
the variables
xc
and
yc
(
rc
and
q
c
in polar mode) by
positioning the graph cursor.
NewPlot
Creates a new stat plot definition.
PlotsOff
Deselects all (or only specified) stat data plots.
PlotsOn
Selects all (or only specified) stat data plots.
setGraph
Changes settings for the various graph formats
(
Coordinates
,
Graph Order
, etc.).
setMode
Sets the
Graph
mode, as well as other modes.
Style
Sets the display style for a function.
Trace
Lets a program trace a graph.
ZoomBox
– to –
ZoomTrig
Perform all of the
Zoom
operations that are available
from the
„
toolbar menu on the Y= Editor, Window
Editor, and Graph screen.
Creating a Table or Graph
To create a table or a graph based on one or more functions or
equations, use the commands listed in this section.
Table Commands
Graphing
Commands
Note: For more information
about using
setMode
, refer
to page 300.