Chapter 9: Sequence Graphing 151
09SEQUEN.DOC TI-89/TI-92 Plus: Sequence Graphing (English) Susan Gullord Revised: 02/23/01 10:59 AM Printed: 02/23/01 2:14 PM Page 151 of 14
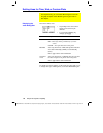
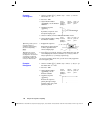
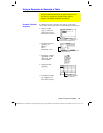
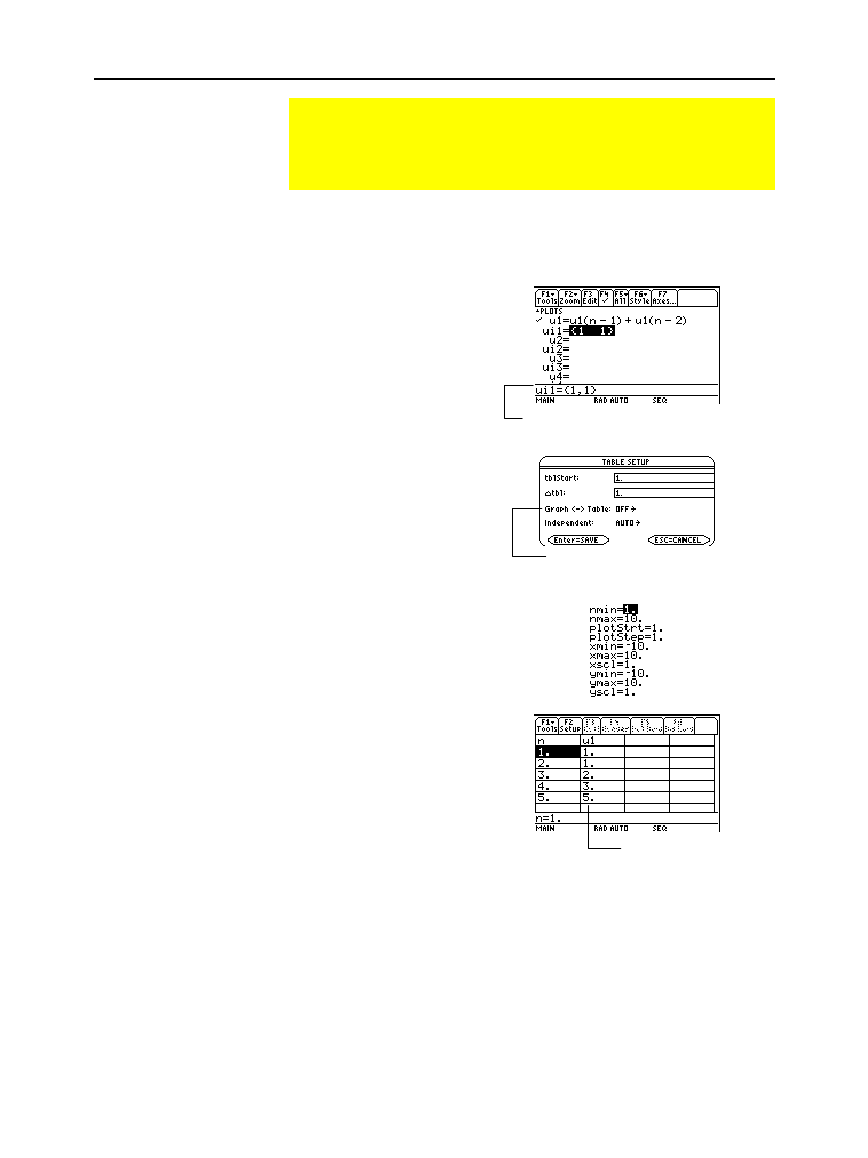
In a Fibonacci sequence, the first two terms are 1 and 1. Each
succeeding term is the sum of the two immediately preceding terms.
1. On the Y= Editor
(
¥#
), define the
sequence and set the
initial values as shown.
2. Set table parameters
(
¥&
) to:
tblStart = 1
@
tbl = 1
Independent =
AUTO
3. Set Window variables
(
¥$
) so that
nmin
has the same
value as
tblStart
.
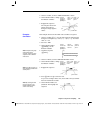
4. Display the table
(
¥'
).
5. Scroll down the table
(
D
or
2D
) to see
more of the sequence.
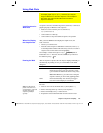
Using a Sequence to Generate a Table
Previous sections described how to graph a sequence. You
can also use a sequence to generate a table. Refer to
Chapter 13 for detailed information about tables.
Example: Fibonacci
Sequence
Fibonacci sequence
is in column 2.
You must enter {1,1}, although {1 1}
is shown in the sequence list.
This item is dimmed if you are not
using TIME axes.


