


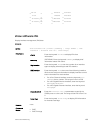

Version Description
7.5.1.0 Introduced on the C-Series.
Usage
Information
show processes
memory output
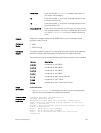
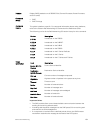
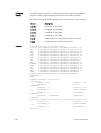
Field
Description
Total: Total system memory available
MaxUsed: Total maximum memory used ever (history indicated with a
time stamp)
CurrentUsed: Total memory currently in use
CurrentFree: Total system memory available
SharedUsed: Total used shared memory
SharedFree: Total free shared memory
PID Process ID
Process Process Name
ResSize Actual resident size of the process in memory
Size Process test, stack, and data size
Allocs Total dynamic memory allocated
Frees Total dynamic memory freed
Max Maximum dynamic memory allocated
Current Current dynamic memory in use
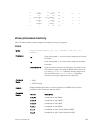
The output for show process memory displays the memory usage statistics
running on the CP part (sysd) of the system. The sysd is an aggregate task that
handles all the tasks running on the Control Processor.
The total counter size in show memory and show processes memory differs
based on which OS processes are counted.
• In the show memory output, the memory size is equal to the size of the
application processes.
• In the show processes memory output, the memory size is equal to the size
of the application processes plus the size of the system processes.
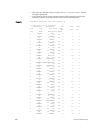
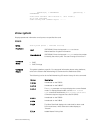
Example: show
processes
memory cp
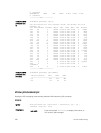
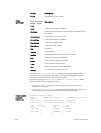
Dell#show processes memory
Total : 3203928064, MaxUsed : 804720640 [01/27/2014
06:16:44]
CurrentUsed: 804720640, CurrentFree: 2399207424
SharedUsed : 9776664, SharedFree : 16437760
PID Process ResSize Size
Allocs Frees Max Current
597 clish 3891200 106496
0 0 0 0
631 login 4816896 217088
0 0 0 0
164
Control and Monitoring