Page 12-20
Θ Press L@CANCL to return to the PLOT WINDOW screen. Press L@@@OK@@@ to
return to normal calculator display.
In this exercise we entered the equation to be plotted directly in the PLOT SETUP
window. We can also enter equations for plotting using the PLOT window, i.e.,
simultaneously if in RPN mode, pressing „ñ. For example, when you
press „ñ after finishing the previous exercise, you will get the equation
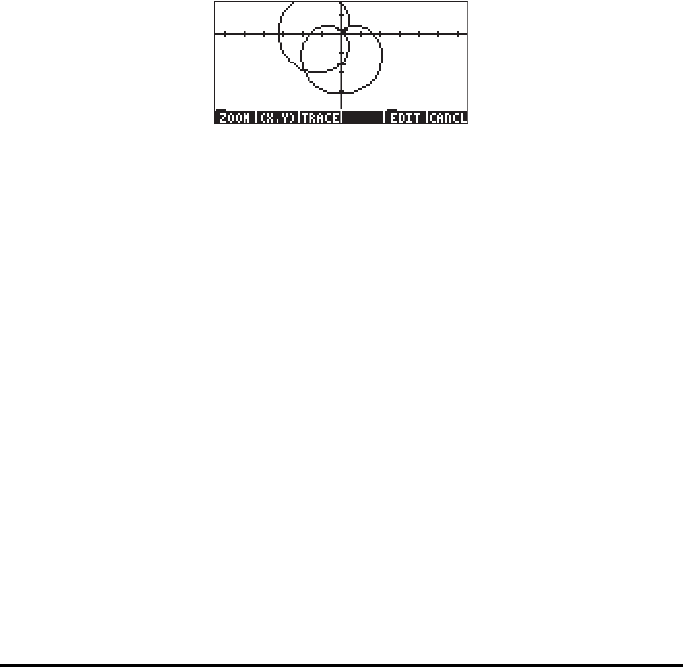
‘2*(1-SIN(θ))’ highlighted. Let’s say, we want to plot also the function ‘2*(1-
COS(θ))’ along with the previous equation.
Θ Press @@ADD@! , and type 2*„Ü1- T~‚t`, to
enter the new equation.
Θ Press @ERASE @DRAW to see the two equations plotted in the same figure. The
result is two intersecting cardioids. Press @CANCL $ to return to normal
calculator display.
Plotting conic curves
The most general form of a conic curve in the x-y plane is:
Ax
2
+By
2
+Cxy+Dx+Ey+F = 0. We also recognize as conic equations those
given in the canonical form for the following figures:
Θ circle: (x-x
o
)
2
+(y-y
o
)
2
= r
2
Θ ellipse: (x-x
o
)
2
/a
2
+ (y-y
o
)
2
/b
2
= 1
Θ parabola: (y-b)
2
= K(x-a) or (x-a)
2
= K(y-b)
Θ hyperbola: (x-x
o
)
2
/a
2
+ (y-y
o
)
2
/b
2
= 1 or xy = K,
where x
o
, y
o
, a, b, and K are constant.
The name conic curves follows because these figures (circles, ellipses, parabolas
or hyperbolas) result from the intersection of a plane with a cone. For example,
a circle is the intersection of a cone with a plane perpendicular to the cone's
main axis.


