Page 16-33
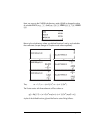
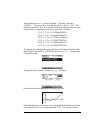
Accept change to Approx mode if requested. The result is the value
–0.40467…. The actual value of the function g(0.5) is g(0.5) = -0.25. The
following calculations show how well the Fourier series approximates this value
as the number of components in the series, given by k, increases:
F (0.5, 1, 1/3) = (-0.303286439037,0.)
F (0.5, 2, 1/3) = (-0.404607622676,0.)
F (0.5, 3, 1/3) = (-0.192401031886,0.)
F (0.5, 4, 1/3) = (-0.167070735979,0.)
F (0.5, 5, 1/3) = (-0.294394690453,0.)
F (0.5, 6, 1/3) = (-0.305652599743,0.)
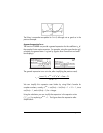
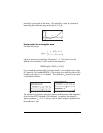
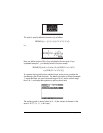
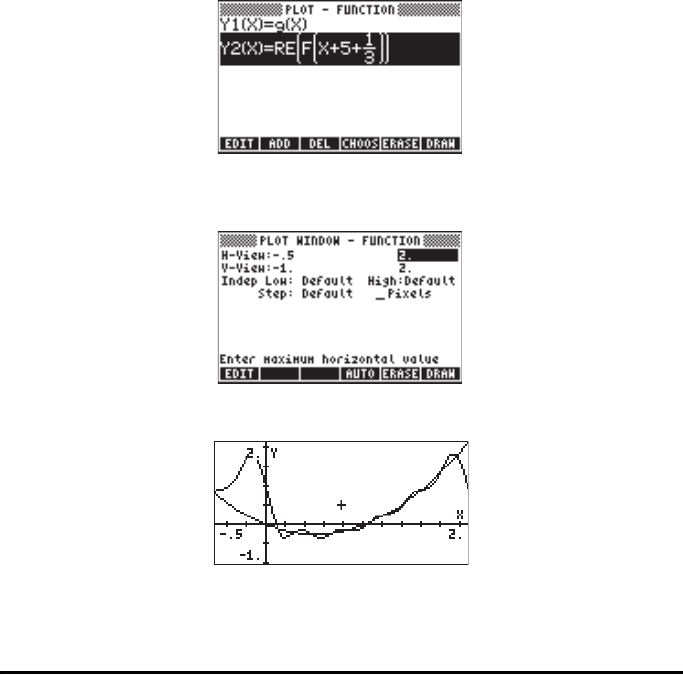
To compare the results from the series with those of the original function, load
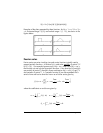
these functions into the PLOT – FUNCTION input form („ñ, simultaneously
if using RPN mode):
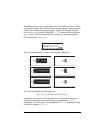
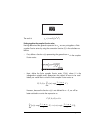
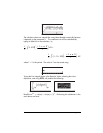
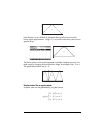
Change the limits of the Plot Window („ò) as follows:
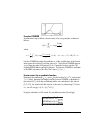
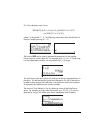
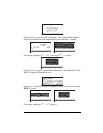
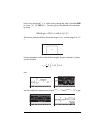
Press the soft-menu keys @ERASE @DRAW to produce the plot:
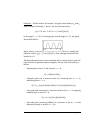
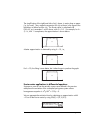
Notice that the series, with 5 terms, “hugs” the graph of the function very closely
in the interval 0 to 2 (i.e., through the period T = 2). You can also notice a


