


Page 12-41
Θ Press „ô, simultaneously if in RPN mode, to access to the PLOT
SETUP window.
Θ Change
TYPE to Gridmap.
Θ Press ˜ and type ‘SIN(X+i*Y)’ @@@OK@@@.
Θ Make sure that ‘X’ is selected as the
Indep: and ‘Y’ as the Depnd: variables.
Θ Press L@@@OK@@@ to return to normal calculator display.
Θ Press „ò, simultaneously if in RPN mode, to access the PLOT
WINDOW screen.
Θ Keep the default plot window ranges to read:
X-Left:-1, X-Right:1, Y-Near:-1 Y-
Far: 1, XXLeft:-1 XXRight:1, YYNear:-1, yyFar: 1,
Step Indep: 10 Depnd: 8
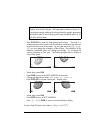
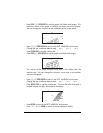
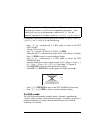
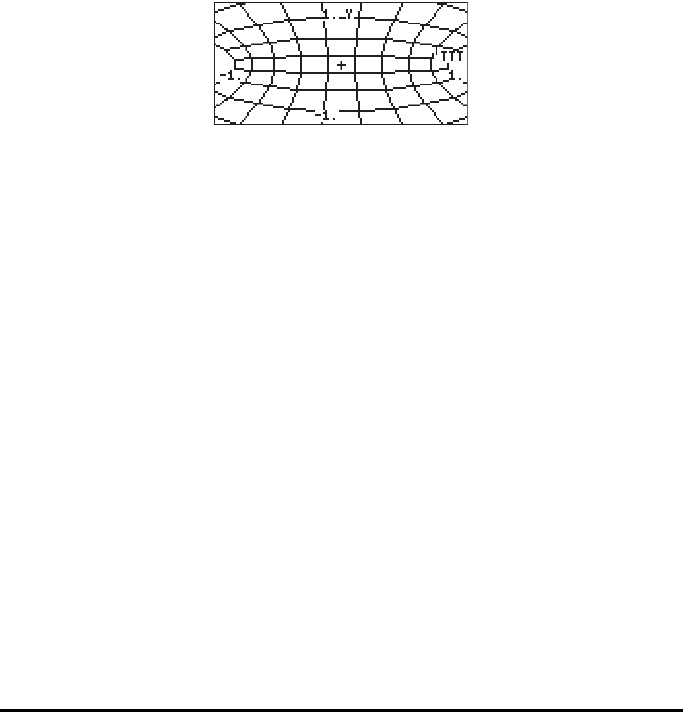
Θ Press @ERASE @DRAW to draw the gridmap plot. The result is a grid of functions
corresponding to the real and imaginary parts of the complex function.
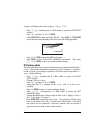
Θ Press @EDIT L@LABEL @MENU to see the graph with labels and ranges.
Θ Press LL@)PICT @CANCL to return to the PLOT WINDOW environment.
Θ Press $ , or L@@@OK@@@, to return to normal calculator display.
Other functions of a complex variable worth trying for Gridmap plots are:
(1) SIN((X,Y)) i.e., F(z) = sin(z) (2)(X,Y)^2 i.e., F(z) = z
2
(3) EXP((X,Y)) i.e., F(z) = e
z
(4) SINH((X,Y)) i.e., F(z) = sinh(z)
(5) TAN((X,Y)) i.e., F(z) = tan(z) (6) ATAN((X,Y)) i.e., F(z) = tan
-1
(z)
(7) (X,Y)^3 i.e., F(z) = z
3
(8) 1/(X,Y) i.e., F(z) = 1/z
(9) √ (X,Y) i.e., F(z) = z
1/2
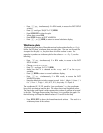
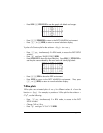
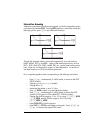
Pr-Surface plots
Pr-Surface (parametric surface) plots are used to plot a three-dimensional
surface whose coordinates (x,y,z) are described by x = x(X,Y), y = y(X,Y),
z=z(X,Y), where X and Y are independent parameters.