Page 12-50
SOLVER.. „Î (the 7 key) Ch. 6
TRIGONOMETRIC.. ‚Ñ (the 8 key) Ch. 5
EXP&LN.. „Ð (the 8 key) Ch. 5
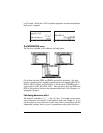
The SYMB/GRAPH menu
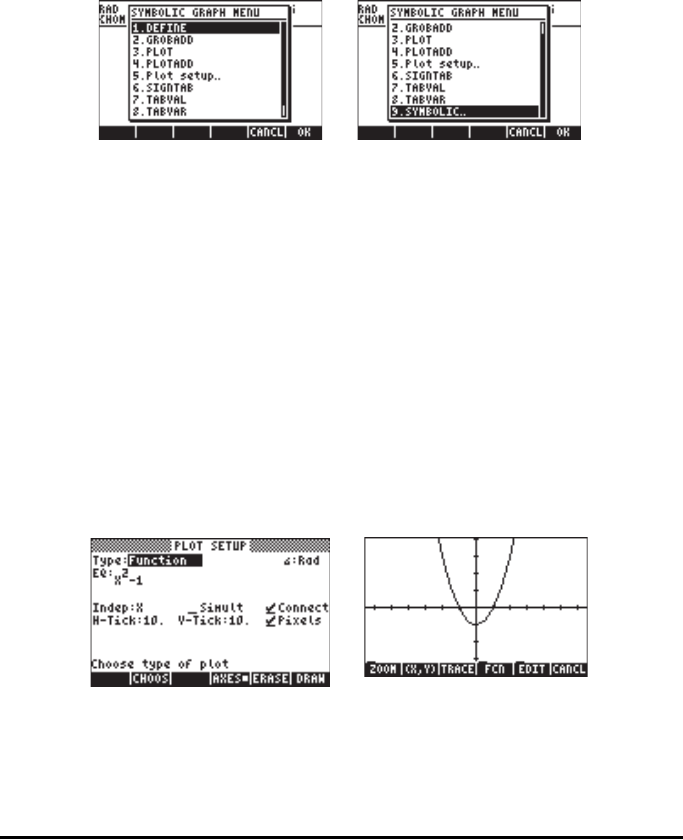
The GRAPH sub-menu within the SYMB menu includes the following functions:
DEFINE: same as the keystroke sequence „à (the 2 key)
GROBADD: pastes two GROBs first over the second (See Chapter 22)
PLOT(function): plots a function, similar to „ô
PLOTADD(function): adds this function to the list of functions to plot, similar to
„ô
Plot setup..: same as „ô
SIGNTAB(function): sign table of given function showing intervals of positive
and negative variation, zero points and infinite asymptotes
TABVAL: table of values for a function
TABVAR: variation table of a function
Examples of some of these functions are provided next.
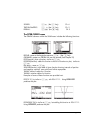
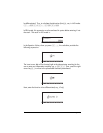
PLOT(X^2-1) is similar to „ô with EQ: X^2 -1. Using @ERASE @DRAW
produces the plot:
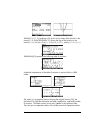
PLOTADD(X^2-X) is similar to „ô but adding this function to EQ: X^2 -1.
Using @ERASE @DRAW produces the plot:


