


Page 22-15
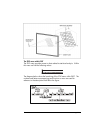
Three-dimensional graphics
The three-dimensional graphics available, namely, options Slopefield,
Wireframe, Y-Slice, Ps-Contour, Gridmap and Pr-Surface, use the VPAR variable
with the following format:
{x
left
, x
right
, y
near
, y
far
, z
low
, z
high
, x
min
, x
max
, y
min
, y
max
,
x
eye
, y
eye
, z
eye
, x
step
, y
step
}
These pairs of values of x, y, and z, represent the following:
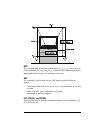
Θ Dimensions of the view parallelepiped (x
left
, x
right
, y
near
, y
far
,
z
low
, z
high
)
Θ Range of x and y independent variables (x
min
, x
max
, y
min
, y
max
)
Θ Location of viewpoint (x
eye
, y
eye
, z
eye
)
Θ Number of steps in the x- and y-directions (x
step
, y
step
)
Three-dimensional graphics also require the PPAR variable with the parameters
shown above.
The variable EQ
All plots, except those based on ΣDAT, also require that you define the function
or functions to be plotted by storing the expressions or references to those
functions in the variable EQ.
In summary, to produce a plot in a program you need to load EQ, if required.
Then load PPAR, PPAR and ΣPAR, or PPAR and VPAR. Finally, use the name of
the proper plot type: FUNCTION, CONIC, POLAR, PARAMETRIC, TRUTH,
DIFFEQ, BAR, HISTOGRAM, SCATTER, SLOPE, WIREFRAME, YSLICE,
PCONTOUR, GRIDMAP, or PARSURFACE, to produce your plot.
Examples of interactive plots using the PLOT menu
To better understand the way a program works with the PLOT commands and
variables, try the following examples of interactive plots using the PLOT menu.
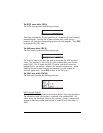
Example 1 – A function plot:
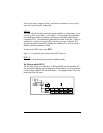
„ÌC Get PLOT menu (*)
@)PTYPE @FUNCT Select FUNCTION as the plot type
‘√r’ `„ @@EQ@@ Store function ‘√r’ into EQ