


Page 22-27
Animating a collection of graphics
The calculator provides the function ANIMATE to animate a number of graphics
that have been placed in the stack. You can generate a graph in the graphics
screen by using the commands in the PLOT and PICT menus. To place the
generated graph in the stack, use PICT RCL. When you have n graphs in levels
n through 1 of the stack, you can simply use the command n ANIMATE to
produce an animation made of the graphs you placed in the stack.
Example 1
– Animating a ripple in a water surface
As an example, type in the following program that generates 11 graphics
showing a circle centered in the middle of the graphics screen and whose
radius increase by a constant value in each subsequent graph.
«Begin program
RAD Set angle units to radians
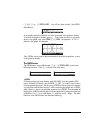
131 RB 64 RB PDIM Set PICT to 131×64 pixels
0 100 XRNG 0 100 YRNG Set x- and y-ranges to 0-100
1 11 FOR j Start loop with j = 1 .. 11
ERASE Erase current PICT
(50., 50.) ‘5*(j-1)’ NUM Centers of circles (50,50)
0 ‘2*π’ NUM ARC Draw circle center r = 5(j-1)
PICT RCL Place current PICT on stack
NEXT End FOR-NEXT loop
11 ANIMATE Animate
» End program
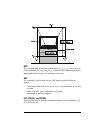
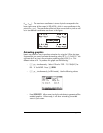
Store this program in a variable called PANIM (Plot ANIMation). To run the
program press J (if needed) @PANIM. It takes the calculator more than one
minute to generate the graphs and get the animation going. Therefore, be
really patient here. You will see the hourglass symbol up in the screen for what
seems a long time before the animation, resembling the ripples produced by a
pebble dropped on the surface of a body of quiescent water, appears in the
screen. To stop the animation, press $.
The 11 graphics generated by the program are still available in the stack. If
you want to re-start the animation, simply use: 11 ANIMATE. (Function