Page 22-10
XVOL (N), YVOL (O), and ZVOL (P)
These functions take as input a minimum and maximum value and are used to
specify the extent of the parallelepiped where the graph will be generated (the
viewing parallelepiped). These values are stored in the variable VPAR. The
default values for the ranges XVOL, YVOL, and ZVOL are –1 to 1.
XXRNG (Q) and
YYRNG (R)
These functions take as input a minimum and maximum value and are used to
specify the ranges of the variables x and y to generate functions z = f(x,y). The
default value of the ranges XXRNG and YYRNG will be the same as those of
XVOL and YVOL.
EYEPT (T)
The function EYEPT takes as input real values x, y, and z representing the
location of the viewpoint for a three-dimensional graph. The viewpoint is a
point in space from which the three-dimensional graph is observed. Changing
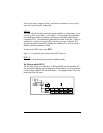
the viewpoint will produce different views of the graph. The figure below
illustrates the idea of the viewpoint with respect to the actual graphic space and
its projection in the plane of the screen.
NUMX(U) and
NUMY (V)
The functions NUMX and NUMY are used to specify the number of points or
steps along each direction to be used in the generation of the base grid from
which to obtain values of z = f(x,y).
VPAR (W)
This is just a reference to the variable VPAR.
RESET (X)
Resets parameters in screen to their default values.
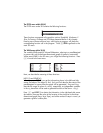
Press L@)@3D@@ to return to the 3D menu.
Press @)PLOT to return to the PLOT menu.


