


Page 16-49
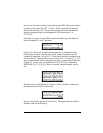
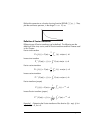
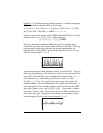
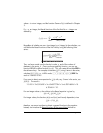
The figure below is a box plot of the data produced. To obtain the graph, first
copy the array just created, then transform it into a column vector by using:
OBJ 1 + ARRY (Functions OBJ and ARRY are available in the
command catalog, ‚N). Store the array into variable ΣDAT by using
function STOΣ (also available through ‚N). Select Bar in the TYPE for
graphs, change the view window to H-VIEW: 0 32, V-VIEW: -10 10, and
BarWidth to 1. Press @CANCL $ to return to normal calculator display.
To perform the FFT on the array in stack level 1 use function FFT available in the
MTH/FFT menu on array ΣDAT: @£DAT FFT. The FFT returns an array of complex
numbers that are the arrays of coefficients X
k
of the DFT. The magnitude of the
coefficients X
k
represents a frequency spectrum of the original data. To obtain
the magnitude of the coefficients you could transform the array into a list, and
then apply function ABS to the list. This is accomplished by using: OBJ μ
ƒ LIST „Ê
Finally, you can convert the list back to a column vector to be stored in ΣDAT, as
follows: OBJ 1 ` 2 LIST ARRY STOΣ
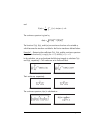
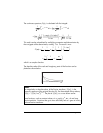
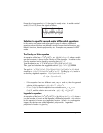
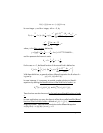
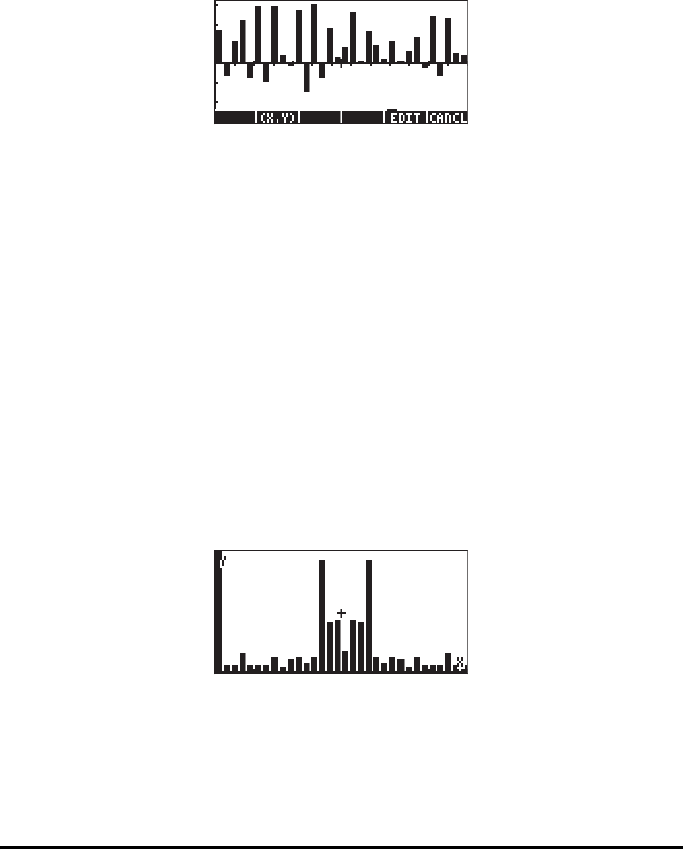
To plot the spectrum, follow the instructions for producing a bar plot given
earlier. The vertical range needs to be changed to –1 to 80. The spectrum of
frequencies is the following:
The spectrum shows two large components for two frequencies (these are the
sinusoidal components, sin (3x) and cos(5x)), and a number of smaller
components for other frequencies.