Page 22-31
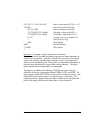
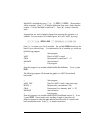
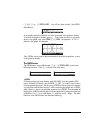
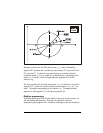
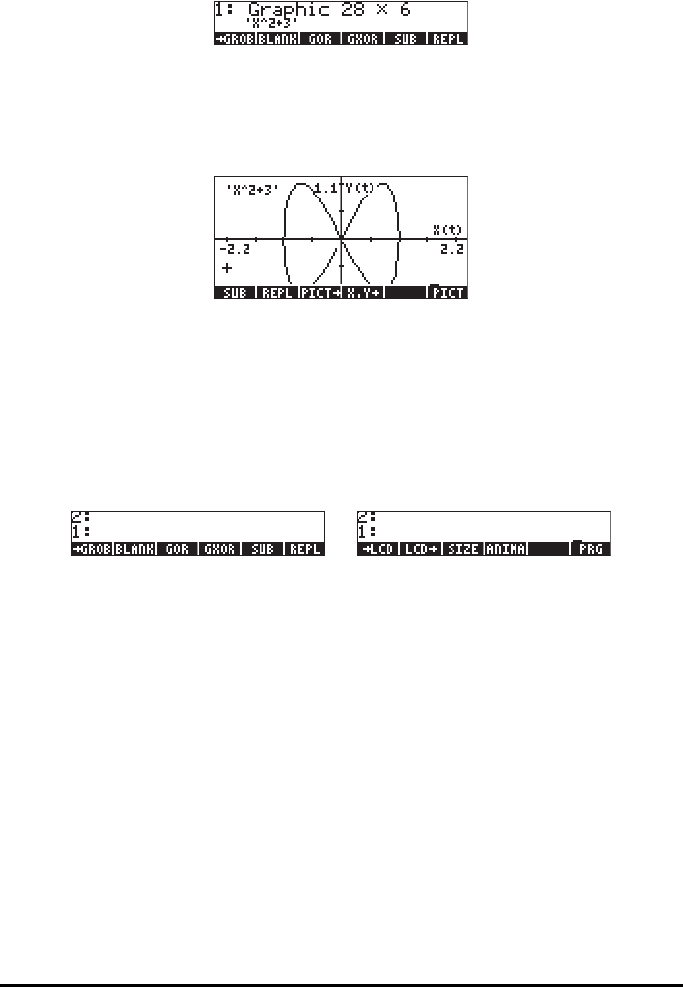
1` „°L@)GROB @GROB . You will now have in level 1 the GROB
described as:
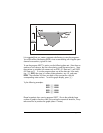
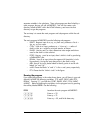
As a graphic object this equation can now be placed in the graphics display.
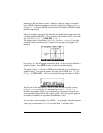
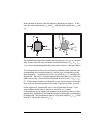
To recover the graphics display press š. Then, move the cursor to an empty
sector in the graph, and press @)EDIT LL@REPL. The equation ‘X^2-5’ is
placed in the graph, for example:
Thus, GROBs can be used to document graphics by placing equations, or text,
in the graphics display.
The GROB menu
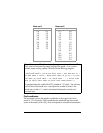
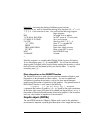
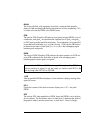
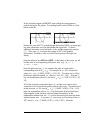
The GROB menu, accessible through „°L@)GROB @GROB, contains the
following functions. Press L to move to the next menu:
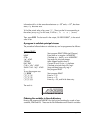
GROB
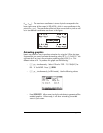
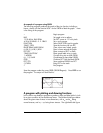
Of these functions we have already used SUB, REPL, (from the graphics EDIT
menu), ANIMATE [ANIMA], and GROB. ([ PRG ] is simply a way to return
to the programming menu.) While using GROB in the two previous examples
you may have noticed that I used a 3 while converting the graph into a GROB,
while I used a 1 when I converted the equation into a GROB. This parameter of
the function GROB indicates the size of the object that is being converted into
a GROB as 0 or 1 – for a small object, 2 – medium, and 3 – large. The other
functions in the GROB menu are described following.


