


Page 12-25
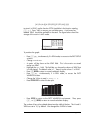
parameters. The other variables contain the values of constants used in the
definitions of X(t) and Y(t).
You can store different values in the variables and produce new parametric
plots of the projectile equations used in this example. If you want to erase the
current picture contents before producing a new plot, you need to access either
the PLOT, PLOT WINDOW, or PLOT SETUP screens, by pressing, „ñ ,
„ò, or „ô (the two keys must be pressed simultaneously if in RPN
mode). Then, press @ERASE @DRAW. Press @CANCL to return to the PLOT, PLOT
WINDOW, or PLOT SETUP screen. Press $, or L@@@OK@@@, to return to
normal calculator display.
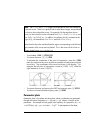
Generating a table for parametric equations
In an earlier example we generated a table of values (X,Y) for an expression of
the form Y=f(X), i.e., a Function
type of graph. In this section, we present the
procedure for generating a table corresponding to a parametric plot. For this
purpose, we’ll take advantage of the parametric equations defined in the
example above.
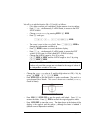
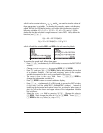
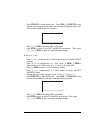
Θ First, let’s access the TABLE SETUP window by pressing „õ,
simultaneously if in RPN mode. For the independent variable change
the
Starting value to 0.0, and the Step value to 0.1. Press @@@OK@@@.
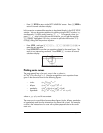
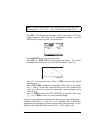
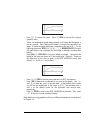
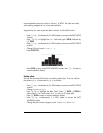
Θ Generate the table by pressing, simultaneously if in RPN mode,
„ö. The resulting table has three columns representing the
parameter t, and the coordinates of the corresponding points. For this
table the coordinates are labeled X1 and Y1.
Θ Use the arrow keys, š™—˜, to move about the table.
Θ Press $ to return to normal calculator display.
This procedure for creating a table corresponding to the current type of plot can
be applied to other plot types.