


Page 13-12
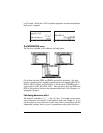
The interpretation of the variation table shown above is as follows: the function
F(X) increases for X in the interval (-∞, -1), reaching a maximum equal to 36 at
X = -1. Then, F(X) decreases until X = 11/3, reaching a minimum of –400/27.
After that F(X) increases until reaching +∞. Also, at X = ±∞, F(X) = ±∞.
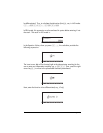
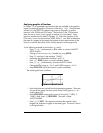
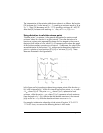
Using derivatives to calculate extreme points
“Extreme points,” or extrema, is the general designation for maximum and
minimum values of a function in a given interval. Since the derivative of a
function at a given point represents the slope of a line tangent to the curve at
that point, then values of x for which f’(x) =0 represent points where the graph
of the function reaches a maximum or minimum. Furthermore, the value of the
second derivative of the function, f”(x), at those points determines whether the
point is a relative or local maximum [f”(x)<0] or minimum [f”(x)>0]. These
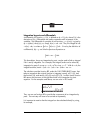
ideas are illustrated in the figure below.
In this figure we limit ourselves to determining extreme points of the function y =
f(x) in the x-interval [a,b]. Within this interval we find two points, x = x
m
and x
= x
M
, where f’(x)=0. The point x = x
m
, where f”(x)>0, represents a local
minimum, while the point x = x
M
, where f”(x)<0, represents a local maximum.
From the graph of y = f(x) it follows that the absolute maximum in the interval
[a,b] occurs at x = a, while the absolute minimum occurs at x = b.
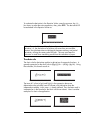
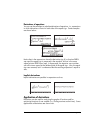
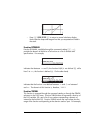
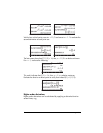
For example, to determine where the critical points of function 'X^3-4*X^2-
11*X+30' occur, we can use the following entries in ALG mode: