


Page 18-13
The general form of the regression equation is η = A + Bξ.
Best data fitting
The calculator can determine which one of its linear or linearized relationship
offers the best fitting for a set of (x,y) data points. We will illustrate the use of
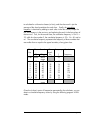
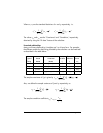
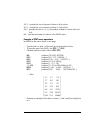
this feature with an example. Suppose you want to find which one of the data
fitting functions provides the best fit for the following data:
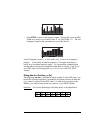
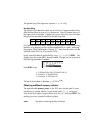
First, enter the data as a matrix, either by using the Matrix Writer and entering
the data, or by entering two lists of data corresponding to x and y and using
the program CRMC developed in Chapter 10. Next, save this matrix into the
statistical matrix ΣDAT, by using function STOΣ.
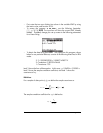
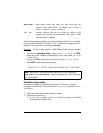
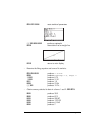
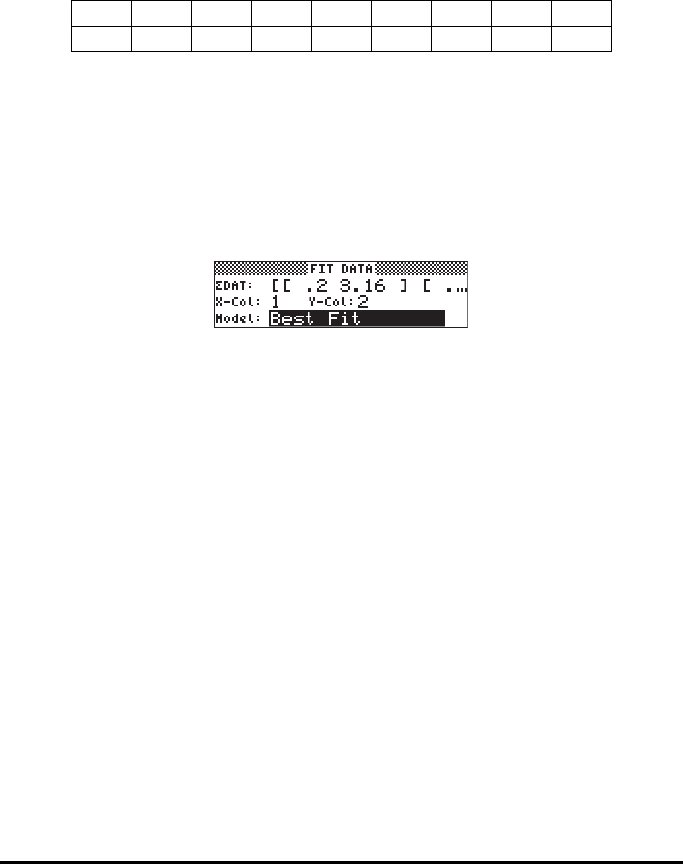
Finally, launch the data fit application by using: ‚Ù˜˜@@@OK@@@ . The
display shows the current ΣDAT, already loaded. Change your set up screen to
the following parameters if needed:
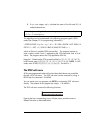
Press @@@OK@@@, to get:
3: '3.99504833324*EXP(-.579206831203*X)'
2: Correlation: -0.996624999526
1: Covariance: -6.23350666124
The best fit for the data is, therefore, y = 3.995 e
-0.58⋅x
.
Obtaining additional summary statistics
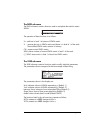
The application 4. Summary stats.. in the STAT menu can be useful in some
calculations for sample statistics. To get started, press ‚Ù once more,
move to the fourth option using the down-arrow key ˜, and press @@@OK@@@. The
resulting input form contains the following fields:
ΣDAT: the matrix containing the data of interest.
x 0.2 0.5 1 1.5 2 4 5 10
y 3.162.732.121.651.290.470.290.01