Page 22-30
produced in the calculator’s screen. Therefore, when an image is converted
into a GROB, it becomes a sequence of binary digits (binary digits = bits), i.e.,
0’s and 1’s. To illustrate GROBs and conversion of images to GROBS consider
the following exercise.
When we produce a graph in the calculator, the graph become the contents of
a special variable called PICT. Thus, to see the last contents of PICT, you could
use: PICT RCL(„°L@)PICT @PICT „©).
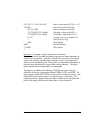
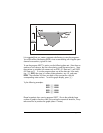
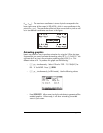
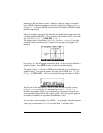
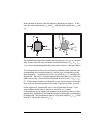
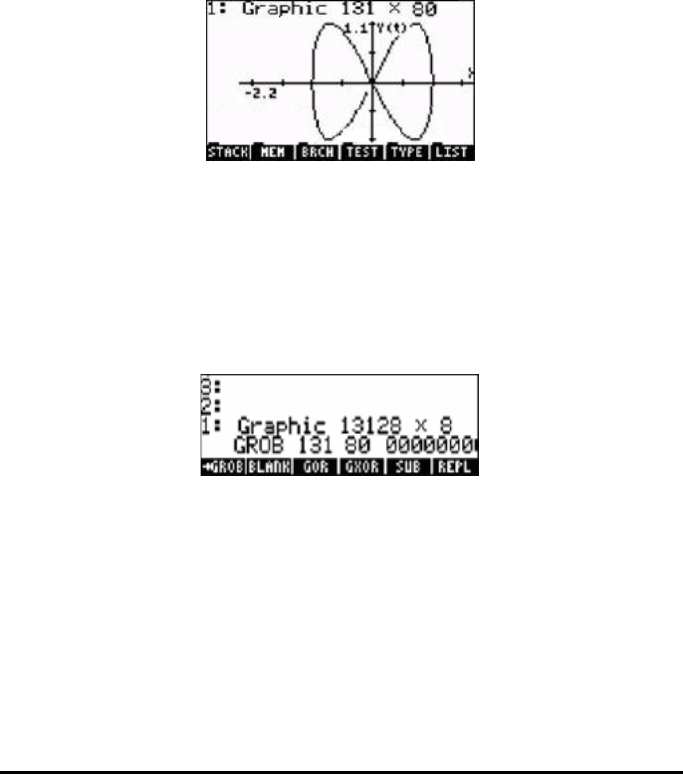
The display shows in stack level 1 the line Graphic 131×80 (if using the
standard screen size) followed by a sketch of the top part of the graph. For
example,
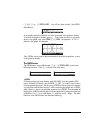
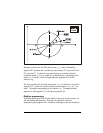
If you press ˜ then the graph contained in level 1 is shown in the calculator’s
graphics display. Press @CANCL to return to normal calculator display.
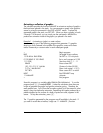
The graph in level 1 is still not in GROB format, although it is, by definition, a
graphics object. To convert a graph in the stack into a GROB, use: 3`
„°L@)GROB @
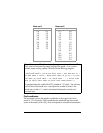
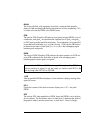
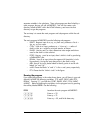
GROB . Now we have the following information in level 1:
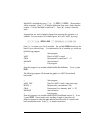
The first part of the description is similar to what we had originally, namely,
Graphic 131×64, but now it is expressed as Graphic 13128 × 8.
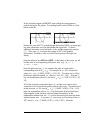
However, the graphic display is now replaced by a sequence of zeroes and
ones representing the pixels of the original graph. Thus, the original graph as
now been converted to its equivalent representation in bits.
You can also convert equations into GROBs. For example, using the equation
writer type in the equation ‘X^2+3’ into stack level 1, and then press


