


Page 22-19
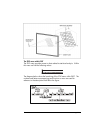
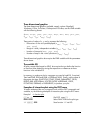
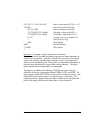
Example 3 – A polar plot. Enter the following program:
«Start program
RAD {PPAR EQ} PURGE Change to radians, purge vars.
‘1+SIN(θ)’ STEQ Store ‘f(θ)’ into EQ
{ θ 0. 6.29} INDEP Set indep. variable to ‘θ’, with range
‘Y’ DEPND Set dependent variable to ‘Y’
POLAR Select POLAR as the plot type
{ (0.,0.) {.5 .5}
“x” “y”} AXES Set axes information
–3. 3. XRNG Set x range
–.5 2.5 YRNG Set y range
ERASE DRAW DRAX LABEL Erase & draw plot, axes, and labels
PICTURE Recall graphics screen to stack
» End program
Store the program in variable PLOT3. To run it, press J, if needed, then
press @PLOT3.
These exercises illustrate the use of PLOT commands in programs. They just
scratch the surface of programming applications of plots. I invite the reader to
try their own exercises on programming plots.
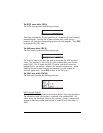
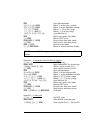
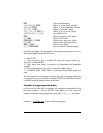
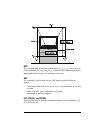
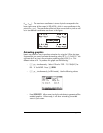
Drawing commands for use in programming
You can draw figures in the graphics window directly from a program by using
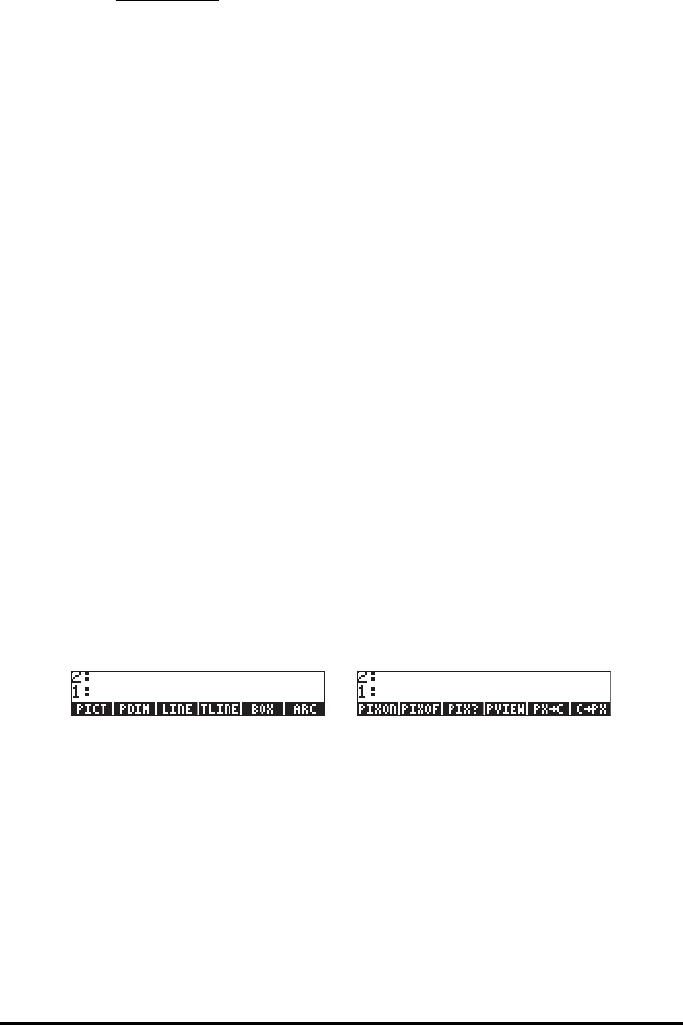
commands such as those contained in the PICT menu, accessible by
„°L@PICT@. The functions available in this menu are the following.
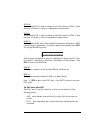
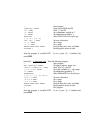
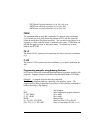
Press L to move to next menu:
Obviously, the commands LINE, TLINE, and BOX, perform the same operations
as their interactive counterpart, given the appropriate input. These and the
other functions in the PICT menu refer to the graphics windows whose x- and y-
ranges are determined in the variable PPAR, as demonstrated above for
different graph types. The functions in the PICT command are described next: