


Page 18-54
a+b⋅x+(t
n-2, α /2
)⋅s
e
⋅[1+(1/n)+(x
0
-⎯x)
2
/S
xx
]
1/2
.
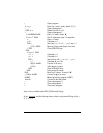
Procedure for inference statistics for linear regression using the
calculator
1) Enter (x,y) as columns of data in the statistical matrix ΣDAT.
2) Produce a scatterplot for the appropriate columns of ΣDAT, and use
appropriate H- and V-VIEWS to check linear trend.
3) Use ‚Ù˜˜@@@OK@@@, to fit straight line, and get a, b, s
xy
(Covariance), and r
xy
(Correlation).
4) Use ‚Ù˜@@@OK@@@, to obtain ⎯x, ⎯y, s
x
, s
y
. Column 1 will show the
statistics for x while column 2 will show the statistics for y.
5) Calculate
,
6) For either confidence intervals or two-tailed tests, obtain t
α/2
, with (1-
α)100% confidence, from t-distribution with ν = n -2.
7) For one- or two-tailed tests, find the value of t using the appropriate
equation for either Α or Β. Reject the null hypothesis if
P-value < α.
8) For confidence intervals use the appropriate formulas as shown above.
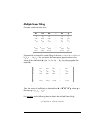
Example 1
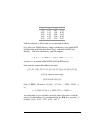
-- For the following (x,y) data, determine the 95% confidence
interval for the slope B and the intercept A
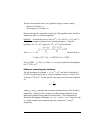
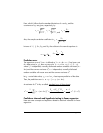
Enter the (x,y) data in columns 1 and 2 of ΣDAT, respectively. A scatterplot of
the data shows a good linear trend:
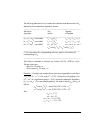
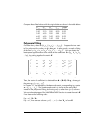
Use the
Fit Data.. option in the ‚Ù menu, to get:
3: '-.86 + 3.24*X'
2: Correlation: 0.989720229749
x 2.0 2.5 3.0 3.5 4.0
y 5.5 7.2 9.4 10.0 12.2
2
)1(
xxx
snS ⋅−=
)1(
2
1
222
xyye
rs
n
n
s −⋅⋅
−
−
=