


Page 22-16
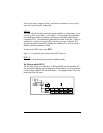
@)PPAR Show plot parameters
~„r` @INDEP Define ‘r’ as the indep. variable
~„s` @DEPND Define ‘s’ as the dependent variable
1 \# 10 @XRNG Define (-1, 10) as the x-range
1 \# 5 @YRNG L Define (-1, 5) as the y-range
{ (0,0) {.4 .2} “Rs” “Sr”} ` Axes definition list
@AXES Define axes center, ticks, labels
L @)PLOT Return to PLOT menu
@ERASE @DRAX L @LABEL Erase picture, draw axes, labels
L @DRAW Draw function and show picture
@)EDIT L@MENU Removes menu labels
LL@)PICT @CANCL Returns to normal calculator display
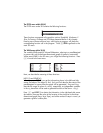
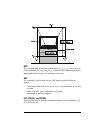
Example 2 – A parametric plot (Use RAD as angles)
:
„ÌC Get PLOT menu
@)PTYPE @PARAM Select PARAMETRIC as the plot type
{ ‘SIN(t)+i*SIN(2*t)’ } ` Define complex function X+iY
„ @@EQ@@ Store complex function into EQ
@)PPAR Show plot parameters
{t 0 6.29} ` @INDEP Define ‘t’ as the indep.variable
~y` @DEPND Define ‘Y’ as the dependent variable
2.2 \# 2.2 @XRNG Define (-2.2,2.2) as the x-range
1.1 \# 1.1 @YRNG L Define (-1.1,1.1) as the y-range
{ (0,0) {.4 .2} “X(t)” “Y(t)”} ` Axes definition list
@AXES Define axes center, ticks, labels
L @)PLOT Return to PLOT menu
@ERASE @DRAX L @LABEL Erase picture, draw axes, labels
L @DRAW Draw function and show picture
@)EDIT L@MENU LL@)PICT @CANCL Finish plot
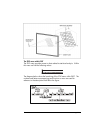
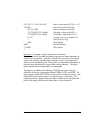
Example 3 – A polar plot
:
„ÌC Get PLOT menu
@)PTYPE @POLAR Select POLAR as the plot type
‘1+SIN(θ)’ `„@@EQ@@ Store complex funct. r = f(θ) into EQ
(*) PLOT menu available through user-defined key C as shown earlier in this
Chapter.