


Page 22-29
Example 2 - Animating the plotting of different power functions
Suppose that you want to animate the plotting of the functions f(x) = x
n
, n = 0,
1, 2, 3, 4, in the same set of axes. You could use the following program:
«Begin program
RAD Set angle units to radians
131 RB 64 RB PDIM Set PICT screen to 131×64 pixels
0 2 XRNG 0 20 YRNG Set x- and y-ranges
0 4 FOR j Start loop with j = 0,1,…,4
‘X^j’ STEQ Store ‘X^j’ in variable EQ
ERASE Erase current PICT
DRAX LABEL DRAW Draw axes, labels, function
PICT RCL Place current PICT on stack
NEXT End FOR-NEXT loop
5 ANIMATE Animate
»
Store this program in a variable called PWAN (PoWer function ANimation).
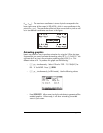
To run the program press J (if needed) @PWAN. You will see the calculator
drawing each individual power function before starting the animation in which
the five functions will be plotted quickly one after the other. To stop the
animation, press $.
More information on the ANIMATE function
The ANIMATE function as used in the two previous examples utilized as input
the graphics to be animated and their number. You can use additional
information to produce the animation, such as the time interval between
graphics and the number of repetitions of the graphics. The general format of
the ANIMATE function in such cases is the following:
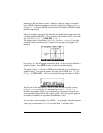
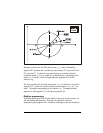
n-graphs { n {#X #Y} delay rep } ANIMATE
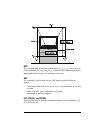
n represents the number of graphics, {#X #Y} stand for the pixel coordinates
of the lower right corner of the area to be plotted (see figure below), delay is
the number of seconds allowed between consecutive graphics in the animation,
and rep is the number of repetitions of the animation.
Graphic objects (GROBs)
The word GROB stands for GRaphics OBjects and is used in the calculator’s
environment to represent a pixel-by-pixel description of an image that has been