Page 22-3
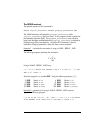
LABEL (10)
The function LABEL is used to label the axes in a plot including the variable
names and minimum and maximum values of the axes. The variable names are
selected from information contained in the variable PPAR.
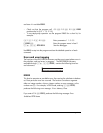
AUTO (11)
The function AUTO (AUTOscale) calculates a display range for the y-axis or for
both the x- and y-axes in two-dimensional plots according to the type of plot
defined in PPAR. For any of the three-dimensional graphs the function AUTO
produces no action. For two-dimensional plots, the following actions are
performed by AUTO:
Θ FUNCTION: based on the plotting range of x, it samples the function in EQ
and determines the minimum and maximum values of y.
Θ CONIC: sets the y-axis scale equal to the x-axis scale
Θ POLAR: based on the values of the independent variable (typically θ), it
samples the function in EQ and determines minimum and maximum values
of both x and y.
Θ PARAMETRIC: produces a similar result as POLAR based on the values of
the parameter defining the equations for x and y.
Θ TRUTH: produces no action.
Θ BAR: the x-axis range is set from 0 to n+1 where n is the number of
elements in ΣDAT. The range of values of y is based on the contents of
ΣDAT. The minimum and maximum values of y are determined so that the
x-axis is always included in the graph.
Θ HISTOGRAM: similar to BAR.
Θ SCATTER: sets x- and y-axis range based on the contents of the
independent and dependent variables from ΣDAT.
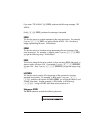
INFO (12)
The function INFO is interactive only (i.e., it cannot be programmed). When
the corresponding soft menu key is pressed it provides information about the
current plot parameters.


