Page 22-7
CENTR (g)
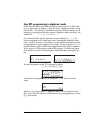
The command CENTR takes as argument an ordered pair (x,y) or a value x,
and adjusts the first two elements in the variable PPAR, i.e., (x
min
, y
min
) and
(x
max
, y
max
), so that the center of the plot is (x,y) or (x,0), respectively.
SCALE (h)
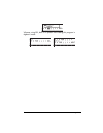
The SCALE command determines the plotting scale represented by the number
of user units per tick mark. The default scale is 1 user-unit per tick mark. When
the command SCALE is used, it takes as arguments two numbers, x
scale
and
y
scale
, representing the new horizontal and vertical scales. The effect of the
SCALE command is to adjust the parameters (x
min
, y
min
) and (x
max
, y
max
) in
PPAR to accommodate the desired scale. The center of the plot is preserved.
SCALEW (i)
Given a factor x
factor
, the command SCALEW multiplies the horizontal scale by
that factor. The W in SCALEW stands for 'width.' The execution of SCALEW
changes the values of x
min
and x
max
in PPAR.
SCALEH (j)
Given a factor y
factor
, the command SCALEH multiplies the vertical scale by that
factor. The H in SCALEH stands for 'height.' The execution of SCALEW
changes the values of y
min
and y
max
in PPAR.
ATICK (l)
The command ATICK (Axes TICK mark) is used to set the tick-mark annotations
for the axes. The input value for the ATICK command can be one of the
following:
Θ A real value x : sets both the x- and y-axis tick annotations to x units
Θ A list of two real values { x y }: sets the tick annotations in the x- and y-axes
to x and y units, respectively.
Θ A binary integer #n: sets both the x- and y-axis tick annotations to #n pixels
Note: Changes introduced by using SCALE, SCALEW, or SCALEH, can be
used to zoom in or zoom out in a plot.


