Page 18-3
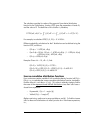
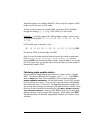
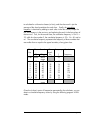
Example 1 -- For the data stored in the previous example, the single-variable
statistics results are the following:
Mean: 2.13333333333, Std Dev: 0.964207949406,
Variance: 0.929696969697
Total: 25.6, Maximum: 4.5, Minimum: 1.1
Definitions
The definitions
used for these quantities are the following:
Suppose that you have a number data points x
1
, x
2
, x
3
, …, representing
different measurements of the same discrete or continuous variable x. The set of
all possible values of the quantity x is referred to as the population
of x. A
finite population
will have only a fixed number of elements x
i
. If the quantity x
represents the measurement of a continuous quantity, and since, in theory, such
a quantity can take an infinite number of values, the population of x in this case
is infinite
. If you select a sub-set of a population, represented by the n data
values {x
1
, x
2
, …, x
n
}, we say you have selected a sample of values of x.
Samples are characterized by a number of measures or statistics
. There are
measures of central tendency
, such as the mean, median, and mode, and
measures of spreading
, such as the range, variance, and standard deviation.
Measures of central tendency
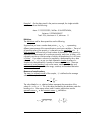
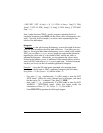
The mean (or arithmetic mean)
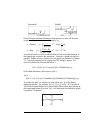
of the sample, ⎯x, is defined as the average
value of the sample elements,
The value labeled
Total obtained above represents the summation of the
values of x, or
Σx
i
= n⋅⎯x. This is the value provided by the calculator under the
heading
Mean. Other mean values used in certain applications are the
geometric mean
, x
g
, or the harmonic mean, x
h
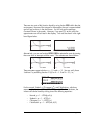
, defined as:
∑
=
⋅=
n
i
i
x
n
x
1
.
1
.
11
,
1
21
∑
=
=⋅=
n
i
ih
n
ng
xx
xxxx L


