Page 12-48
You can always return to the very last zoom window by using @ZLAST.
BOXZ
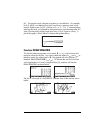
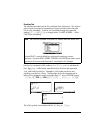
Zooming in and out of a given graph can be performed by using the soft-menu
key BOXZ. With BOXZ you select the rectangular sector (the “box”) that you
want to zoom in into. Move the cursor to one of the corners of the box (using
the arrow keys), and press @)ZOOM @BOXZ. Using the arrow keys once more, move
the cursor to the opposite corner of the desired zoom box. The cursor will trace
the zoom box in the screen. When desired zoom box is selected, press @ZOOM.
The calculator will zoom in the contents of the zoom box that you selected to fill
the entire screen.
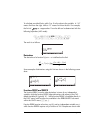
If you now press @ZOUT, the calculator will zoom out of the current box using the
H- and V-Factors, which may not recover the graph view from which you started
the zoom box operation.
ZDFLT, ZAUTO
Pressing @ZDFLT re-draws the current plot using the default x- and y-ranges, i.e., -
6.5 to 6.5 in x, and –3.1 to 3.1 in y. The command @ZAUTO, on the other hand,
creates a zoom window using the current independent variable (x) range, but
adjusting the dependent variable (y) range to fit the curve (as when you use the
function @AUTO in the PLOT WINDOW input form („ò, simultaneously in
RPN mode).
HZIN, HZOUT, VZIN and VZOUT
These functions zoom in and out the graphics screen in the horizontal or vertical
direction according to the current H- and V-Factors.
CNTR
Zooms in with the center of the zoom window in the current cursor location. The
zooming factors used are the current H- and V-Factors.
ZDECI
Zooms the graph so as to round off the limits of the x-interval to a decimal
value.
ZINTG
Zooms the graph so that the pixel units become user-define units. For example,
the minimum PICT window has 131 pixels. When you use ZINTG, with the


