


Page 18-9
« DUP SIZE 1 GET freq k « {k 1} 0 CON cfreq « ‘freq(1,1)’ EVAL
‘cfreq(1,1)’ STO 2 k FOR j ‘cfreq(j-1,1) +freq(j,1)’ EVAL ‘cfreq (j,1)’ STO NEXT
cfreq » » »
Save it under the name CFREQ. Use this program to generate the list of
cumulative frequencies (press @CFREQ with the column vector of frequencies in the
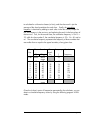
stack). The result, for this example, is a column vector representing the last
column of the table above.
Histograms
A histogram
is a bar plot showing the frequency count as the height of the bars
while the class boundaries shown the base of the bars. If you have your raw
data (i.e., the original data before the frequency count is made) in the variable
ΣDAT, you can select Histogram as your graph type and provide information
regarding the initial value of x, the number of bins, and the bin width, to
generate the histogram. Alternatively, you can generate the column vector
containing the frequency count, as performed in the example above, store this
vector into
ΣDAT, and select Barplot as your graph type. In the next example,
we show you how to use the first method to generate a histogram.
Example 1
– Using the 200 data points generated in the example above
(stored as a column vector in
ΣDAT), generate a histogram plot of the data
using X-Min = 10, Bin Count = 16, and Bin Width = 5.
Θ First, press „ô (simultaneously, if in RPN mode) to enter the PLOT
SETUP screen. Within this screen, change Type: to Histogram, and check
that the option Col: 1 is selected. Then, press L@@@OK@@@.
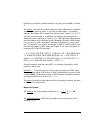
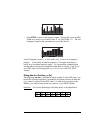
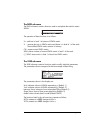
Θ Next, press „ò (simultaneously, if in RPN mode) to enter the PLOT
WINDOW – HISTOGRAM screen. Within that screen modify the
information to H-View: 10 90, V-View: 0 15, Bar Width: 5.
Θ Press @ERASE @DRAW@ to generate the following histogram: