


Chapter 3 Peak Detection and Labeling
3-4 Applied Biosystems
3
The software uses the following formula to calculate the
expected number of data points in a peak:
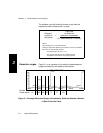
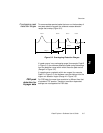
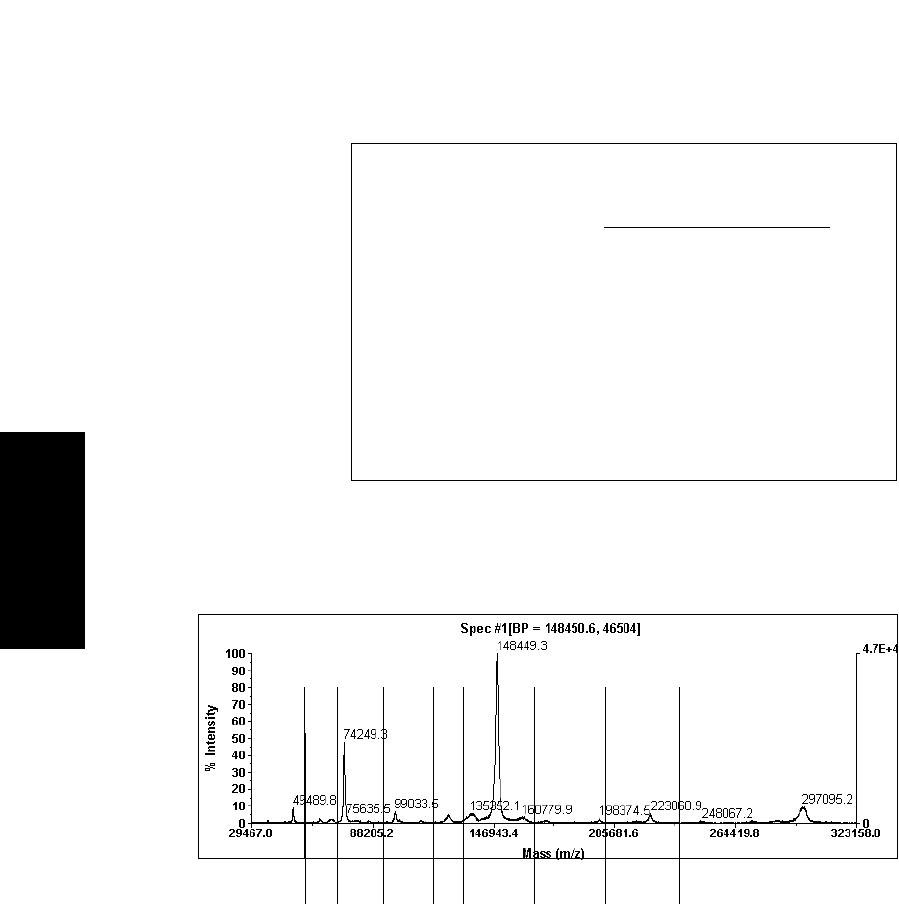
Detection ranges Figure 3-1 is an example of the resolution-based detection
ranges automatically calculated by the software.
Figure 3-1 Example Detection Ranges Calculated by Software Based on Number
of Data Points Per Peak
number of
Flight time
data points
(2 × mass resolution × Bin size)
to which the
data point corresponds
=
Where:
· For Mariner data, Bin size = 1 ns.
Bin size is an instrumental constant:
Mass resolution is a user-defined value.
Data-type-dependent defaults are provided, but can be overwritten.
Expected
· For Voyager data, Bin size is variable based on
the digitizer used and the mass range acquired.
41 47 53 59 65 71 77 83
Number
of data points