


Overview
Data Explorer
™
Software User’s Guide 4-3
4
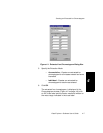
You can display extracted chromatograms from Mariner data
files by selecting the Process menu with a Chromatogram
window displayed, then selecting:
Types of
Voyager data
Voyager chromatograms can optionally be displayed for
multispectrum .DAT files. To display a Voyager chromatogram,
select Restore Chromatogram from the View menu. For
more information, see Section 2.1.3, Displaying Voyager
Chromatograms.
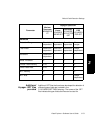
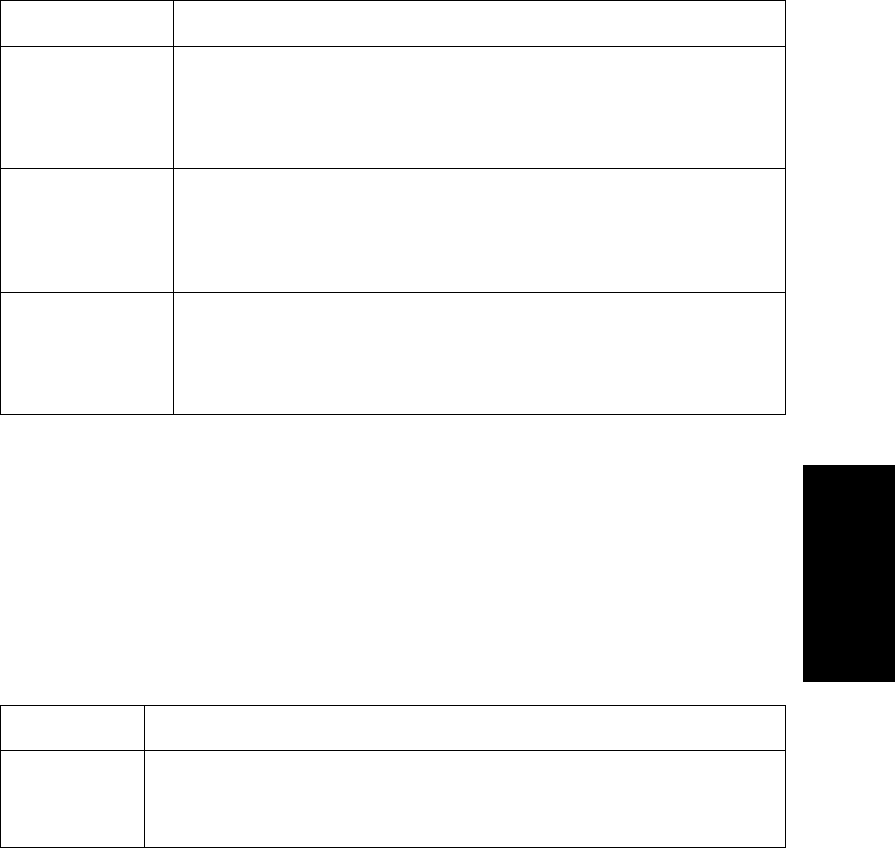
If you have a chromatogram displayed, you can display the
following type of Voyager data by selecting Traces from the
View menu, then selecting:
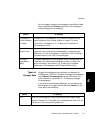
Select To display
Extracted Ion—
Center Window
or Range
Extracted Ion Chromatogram (XIC), which includes only the
signal response from a mass window or range. For more
information, see Section 4.2.1, Creating an Extracted Ion
Chromatogram (XIC).
Extracted Ion—
Neutral Loss
Constant Neutral Loss chromatogram, which extracts only the
response from peaks that are separated by a selected mass
difference. For more information, see Section 4.2.2, Creating a
Constant Neutral Loss (CNL) Chromatogram.
Extracted
Absorbance
(XAC)
Extracted Absorbance Chromatogram, which includes only the
response from a specified wavelength window or range. For
more information, see Section 4.3, Creating an Extracted
Absorbance Chromatogram (XAC) (Mariner Data Only).
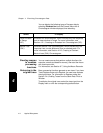
Select To display
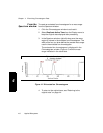
TIC Total Ion Chromatogram, which includes the entire mass range
saved in the data file. Each data point represents the sum of all ion
intensities in the corresponding spectrum.