


Chapter 2 Using Chromatogram and Spectrum Windows
2-16 Applied Biosystems
2
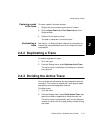
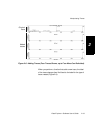
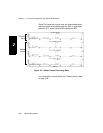
For example, if you select Divide Active Trace to Four
when the active trace has a range of 0.0 to 20.0, the
active trace is divided into four traces:
• First trace represents the range from 0 to 5
• Second trace represents the range from 4 to 10
• Third trace represents the range from 9 to 16
• Fourth trace represents the range from 15 to 20
NOTE: To restore the display to a single trace, select
Remove Inactive Traces from the Display menu.
2.4.4 Adding Traces from
the Same Data File to a Window
This section describes:
• Overview
• Setting the Replace mode
• Adding a trace
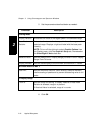
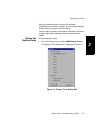
Overview By default, the Data Explorer software displays:
Chromatogram and Spectrum windows each contain
one trace (see Figure 1-3 on page 1-11).
Data Type Window
Mariner Chromatogram and Spectrum.
Voyager single
spectrum
Spectrum only.
Voyager
multispectrum
Spectrum only. Can also optionally
display chromatogram.