Chapter 1 Data Explorer™ Basics
1-2 Applied Biosystems
1
1.1 Overview
Description The Data Explorer
™
Version 4.0 processing software is
graphical software that you use to analyze, calibrate, and
report data. You can use the Data Explorer software to
analyze data collected on:
• Mariner
™
Workstations
• Voyager
™
-DE Biospectrometry
™
Workstations
NOTE: Application systems that automatically acquire
and process data, such as Mariner High Throughput
Analysis Option (CombiSolve
™
) and Proteomics
Solution 1
™
Option, require specific versions of Data
Explorer software.
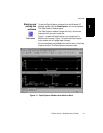
Features Data Explorer software includes a suite of tools and
processing options to allow you to graphically and interactively
manipulate chromatographic and mass spectral data. For
example, you can:
• Smooth and noise-filter data.
• Automatically and manually calibrate spectral data.
• Set peak detection parameters and custom labels for
regions of the trace. Detected peaks can be evaluated
for charge-state determination according to
user-defined parameters.
• Determine elemental composition, theoretical isotope
distributions, resolution, signal-to-noise ratio, and
fragment ions.
• Perform target compound analysis (elemental
targeting).
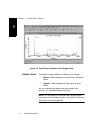
• Customize windows, toolbars, and traces.
• Create scripts and macros to automate your work using
the Macro Recorder and Visual Basic
®
Editor.


