


Truncating a Spectrum
Data Explorer
™
Software User’s Guide 5-57
5
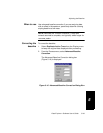
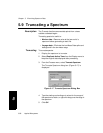
The data in the spectrum is truncated to the selected
range and is displayed with a TR trace label. The range
displayed on the axis of the truncated trace is the range
of the original data file, and may be wider than the
range of the truncated spectrum.
6. To return to the original trace, see “Returning to the
original spectrum” on page 5-3.
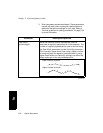
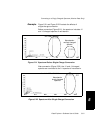
Example Figure 5-18 and Figure 5-19 illustrate the effects of
truncating a Voyager spectrum and eliminating the Low
Mass Gate peak.
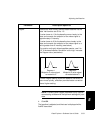
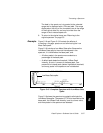
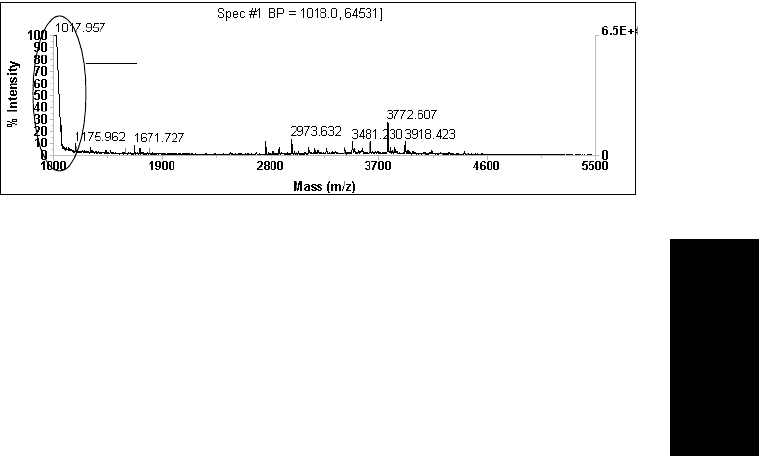
Figure 5-18 includes a Low Mass Gate spike. Because the
Low Mass Gate spike is the most intense peak in the
spectrum, it is identified as the base peak, and:
• All other peaks in the spectrum are scaled as a
percentage of the base peak.
• A default peak detection threshold, %Base Peak
Intensity, is set to 1 percent of the base peak. One
percent of an intense peak yields a high default threshold,
and many peaks in the spectrum are not detected.
Figure 5-18 Complete Spectrum with Low Mass Gate
Spike
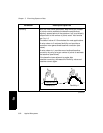
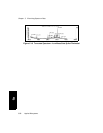
Figure 5-19 shows the spectrum truncated to eliminate the
Low Mass Gate spike. The peak at 3772 Da is identified as the
base peak, the %Base Peak Intensity is set to a lower value,
and more peaks in the spectrum are detected.
Low Mass Gate spike