


Chapter 3 Peak Detection and Labeling
3-26 Applied Biosystems
3
Peak Processing
parameters
(spectrum data
only)
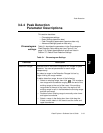
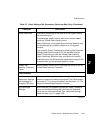
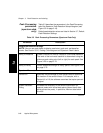
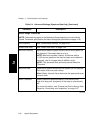
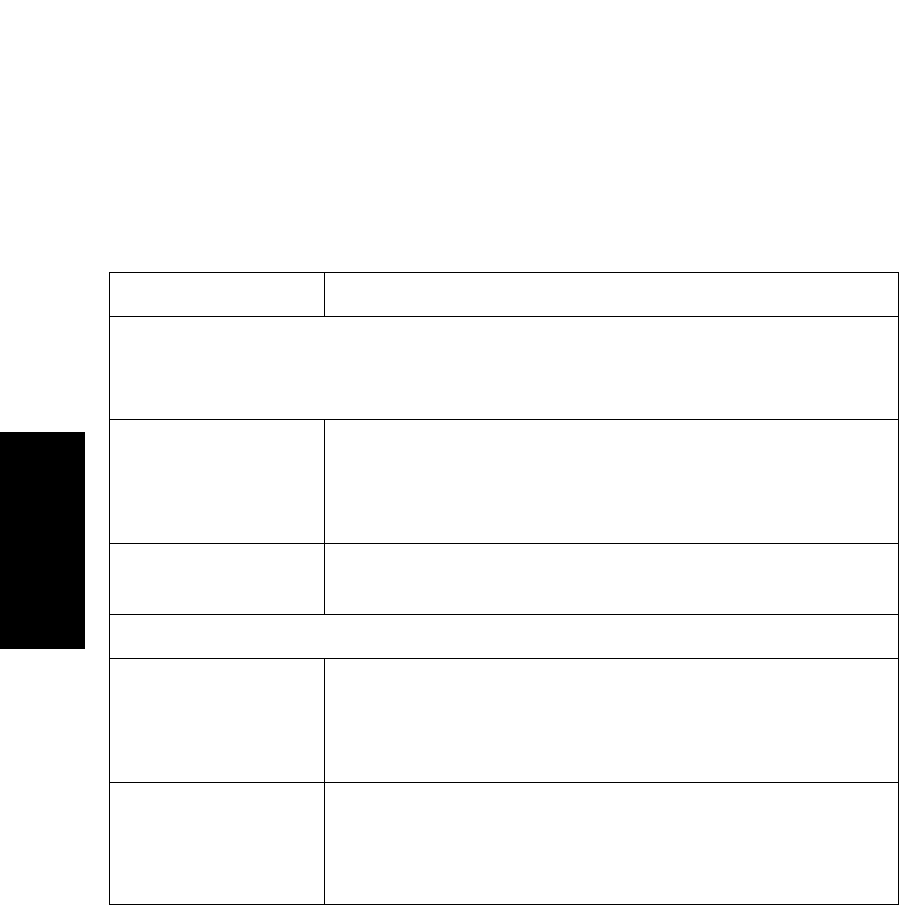
Table 3-3 describes the parameters in the Peak Processing
tab of the Spectrum Peak Detection Setup dialog box (see
Figure 3-5 on page 3-16).
Default peak detection values are listed in Section 3.7, Default
Peak Detection Settings.
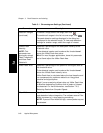
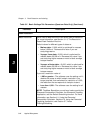
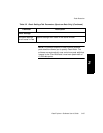
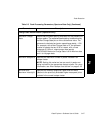
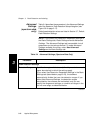
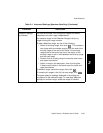
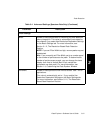
Table 3-3 Peak Processing Parameters (Spectrum Data Only)
Parameter Description
Integration Baseline Settings
NOTE: You can set peak labels to display peak start, peak end, and baseline
marks. See Section 3.5.2, Setting Chromatogram and Spectrum Peak Labels.
Valley-to-Baseline Draws a vertical line from all valleys to a horizontal baseline.
The level of the horizontal baseline is determined using the
minimum peak valley point (left or right) for each peak. See
Figure 3-25 on page 3-70.
Valley-to-Valley Forces a baseline through all valley points. See Figure 3-25
on page 3-70.
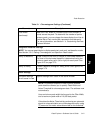
Spectrum Parameters
Centroid % Specifies the percentage of peak height used to determine
the location of the centroid mass. For example, with a
Centroid % of 10, the software examines the top ten percent
of signal.
Enable Gaussian
Fitting
Increases the accuracy of the centroid calculation for
spectral peaks with limited data points (fewer than 6 data
points across the peak), in particular, Mariner data below
m/z 400.
Continued