


Overview
Data Explorer
™
Software User’s Guide 3-5
3
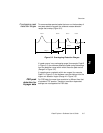
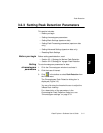
Overlapping peak
detection ranges
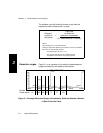
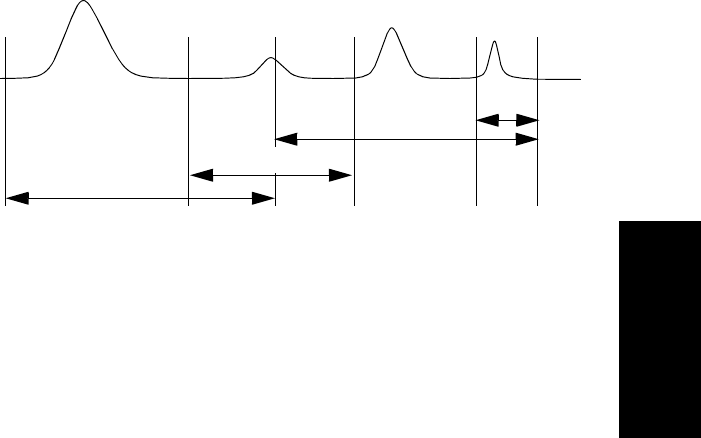
To accommodate spectral peaks that occur on the boundary of
two peak detection ranges, the software creates detection
ranges that overlap (Figure 3-2).
Figure 3-2 Overlapping Detection Ranges
If a peak occurs in an overlapping range (for example, Peak B
in Figure 3-2), the software detects the peak using the settings
from the detection range within which the entire peak occurs
(Range 2 in Figure 3-2).
If a peak occurs completely within two ranges (for example,
Peak D in Figure 3-2), the software uses the settings from the
higher m/z detection region (Range 4 in Figure 3-2).
PSD peak
detection for
Voyager data
For PSD data, the mass-time correlation is different from that
of standard TOF spectra. Therefore, resolution-dependent
settings are not supported for PSD data.
Range 1
Range 2
Range 3
Range 4
Peak A Peak B Peak C Peak D