


Adjusting the Baseline
Data Explorer
™
Software User’s Guide 5-51
5
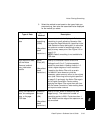
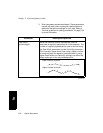
Peak Width
(at half height)
(continued)
Set Peak Width according to the data you are correcting:
• For best results, set to the peak width at half height
of the narrowest peak. However, smaller peak width
values increase processing time.
• If peak width varies across the spectrum, set to the
average peak width.
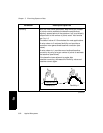
• If peaks are narrow relative to the baseline region
you are correcting, set a larger value (for example,
10 times the width of widest peak) to increase
processing speed.
• If the baseline changes sharply across the spectrum,
set a smaller value closer to the narrowest peak
width.
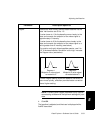
• If the baseline is broad or gently sloping, set a larger
value, for example 10 to 20 times the width of the
actual peak width.
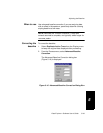
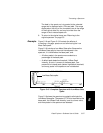
To determine the number of points across a peak, change
the trace display from Line to Vertical Bars (select
Graphic Options from the Display menu, click Graph #
Setup and change Line Type). Each vertical bar
represents one data point. For more information, see
Section 1.4, Customizing the Data Explorer Window.
(continued)
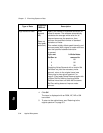
Parameter Description/Specifies