


Chapter 5 Examining Spectrum Data
5-2 Applied Biosystems
5
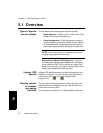
5.1 Overview
Types of spectra
you can display
You can display the following types of spectrum data:
• Single spectrum—Double-click any point in the TIC to
display the corresponding spectrum.
• Combined spectrum—Click-drag across a region of
the chromatogram to sum the intensity at each mass for
all selected spectra. Combining spectra can improve
peak shape, signal intensity, and signal-to-noise ratio.
NOTE: You cannot display a combined spectrum for
Voyager single-spectrum data files.
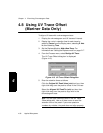
• DAD spectrum (Mariner DAD data only)—Click the
Chromatogram window, select Traces from the Display
menu, select the DAD TAC or channel of interest, then
double-click any point in the TAC or channel data trace to
display the corresponding DAD spectrum.
Voyager PSD
spectra
Voyager PSD data files contain the precursor spectrum and
fragment ion spectra. You can view up to eight spectra at a
time and can click and to display other
fragment ions.
Creating macros
to combine
processing
functions
You can create macros that perform multiple functions (for
example, smooth and baseline correct), and then start the
macro with one mouse click.
For information, see Section 6.7, Using the Macro Recorder.