


Process that Occurs During Peak Detection, Centroiding, and Integration
Data Explorer
™
Software User’s Guide 3-67
3
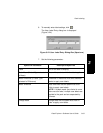
3.6 Process that Occurs
During Peak Detection,
Centroiding, and Integration
This section gives an overview of the process that occurs
during peak detection, centroiding and integration. Parameters
are defined in detail in Section 3.2.4, Peak Detection
Parameter Descriptions.
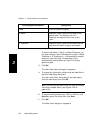
Peak detection During peak detection, the Data Explorer software:
• Divides the trace into detection ranges based on the
number of data points per peak (described in
Section 3.1.2, The Resolution-Based Peak Detection
Routine).
• Starts scanning the chromatogram or spectrum at the
origin of the x-axis.
• Applies a Gaussian sliding filter to the number of raw data
points defined by the Filter Width setting. The filter moves
across the raw data by the number of data points
specified by the Increment parameter. An Increment of 1
is used for chromatogram data.
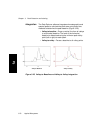
• Searches for an upward-to-downward inflection point
greater than the larger of the two specified peak detection
thresholds (% Base Peak Intensity or Minimum Intensity).
A Minimum Intensity of 2 is used for chromatogram data.
This inflection point defines the apex region.
• After the apex region is identified, scans to find the
downward-to-upward inflection points. These downward
to upward inflection points are the valley regions of the
peak.