


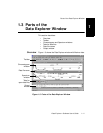

Parts of the Data Explorer Window
Data Explorer
™
Software User’s Guide 1-13
1
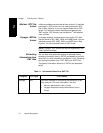
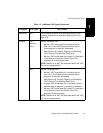
SPEC Displays the spectrum for the selected time in the TIC or TAC trace. By
default, displays spectrum #1. The trace label includes “DAD” for spectra
selected from TAC.
Indicates Base Peak (BP) mass and intensity for the tallest peak in the
spectrum. Displayed as % Intensity versus Mass-to-Charge (m/z). The
right axis is scaled to the intensity of the base peak.
Table 1-3 Mariner Data Displayed in Chromatogram and Spectrum Windows
(Continued)
Window Mariner Data
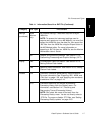
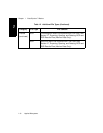
Table 1-4 Voyager Data Displayed in Chromatogram and Spectrum Windows
Window Voyager Data
CHRO Window is not displayed by default.
Optionally displays Total Ion Current (TIC) for multiple spectra .DAT files if
you select Restore Chromatogram from the View menu.
NOTE: DAD functions are not supported for Voyager data.
SPEC Depends on the type of data file you open:
• Single spectrum files—Displays the spectrum and labels the plot as
spectrum #1.
• Multiple spectrum files—Displays the spectrum for the selected
time in the TIC trace (if displayed). By default, displays spectrum #1.
• PSD files—Displays the composite spectrum and labels it as
Stitched PSD. You can display segment spectra by clicking
and .
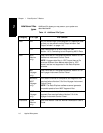
Indicates Base Peak (BP) mass and intensity for the tallest peak in the
spectrum. Displayed as % Intensity versus Mass-to-Charge (m/z). The
right axis is scaled to the intensity of the base peak.